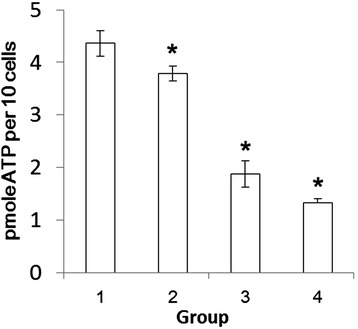
Figure 4.

ATP generation on shrimp hemocytes surface measured by bioluminescent luciferase assay. (1) ATP production from WSSV free cells, (2) ATP production from cells with WSSV bound on the surface, (3) ATP production from WSSV naturally infected shrimp cells, (4) ATP production from WSSV infected cells that incubated with anti- rBP53-antibody. Asterisk (*) indicates a significant statistical difference between groups (p < 0.05).
