Fig. 1.
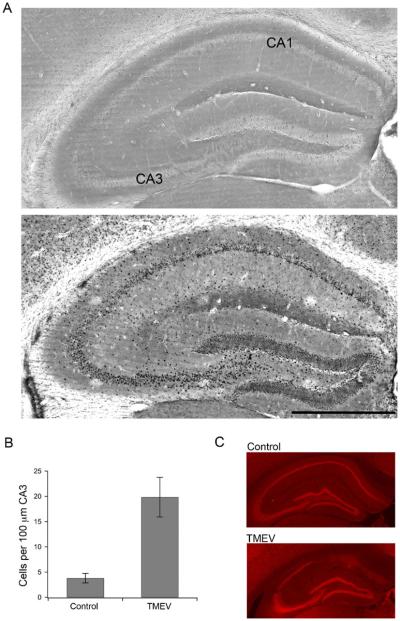
Enhanced Fos immunoreactivity in the dorsal hippocampus following TMEV-induced seizure activity. a (top) Bright field image of dorsal hippocampus from a control animal showing minimal Fos labeling. (Bottom) Bright field image of a TMEV-infected dorsal hippocampus with a number of Fos labeled neurons. Bar=500 μm. b Bar graph showing the difference (p=0.015) between control (N=4) and TMEV-infected mice (N=7) in average number of Fos labeled cells per 100 μm of CA3 in the dorsal hippocampus. c Images of the dorsal hippocampus stained for the neuronal marker, NeuN, demonstrating the damage to CA1 in TMEV-infected mice (bottom) versus saline injected control mice (top)

