Fig. 2.
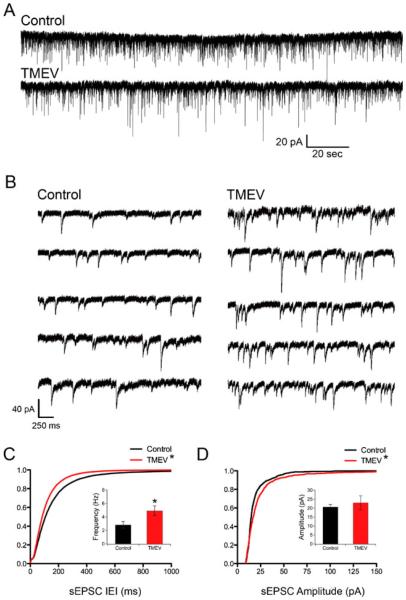
Acute TMEV infection results in increased number and amplitude of sEPSCs in CA3 neurons. a Recordings of sEPSCS from CA3 neurons from control (PBS injected) and TMEV-injected animals. b Example traces on a faster time scale collected from the traces in a. c Cumulative distributions of IEIs showing a leftward shift of the experimental distribution indicating a higher frequency of events (KS test, p<0.0001) and the inset bar graph shows the significant increase in average frequency (control, 2.82±0.51 Hz, N=8; TMEV, 4.92±0.72 Hz, N=10; p=0.039, t test). d Cumulative distributions of sEPSC amplitudes with a shift toward larger amplitudes in the TMEV-infected mouse (KS test, p<0.0001), but there is no increase (inset) in average sEPSC amplitudes (p=0.61; control, N=8; TMEV, N=10)

