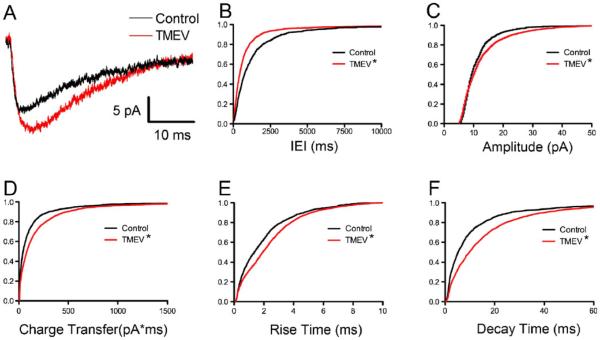
Fig. 4.
Acute TMEV infection results in increased mEPSC frequency and amplitude coupled with slower kinetics. a Example average mEPSC recordings from PBS-injected and TMEV-injected mice. b Cumulative IEI distributions showing shortening of mEPSC intervals (KS test, p <0.0001). c The amplitude cumulative distribution is shifted to the right in the TMEV-infected mouse (KS test, p < 0.0001). d Consistent with the change in amplitude, mEPSC charge transfer is also increased (KS test, p<0.0001). e A rightward shift in the cumulative distribution of rise times shows a slowing of kinetics (KS test, p<0.0001). f Decay times also have slower kinetics (KS test, p<0.0001)

