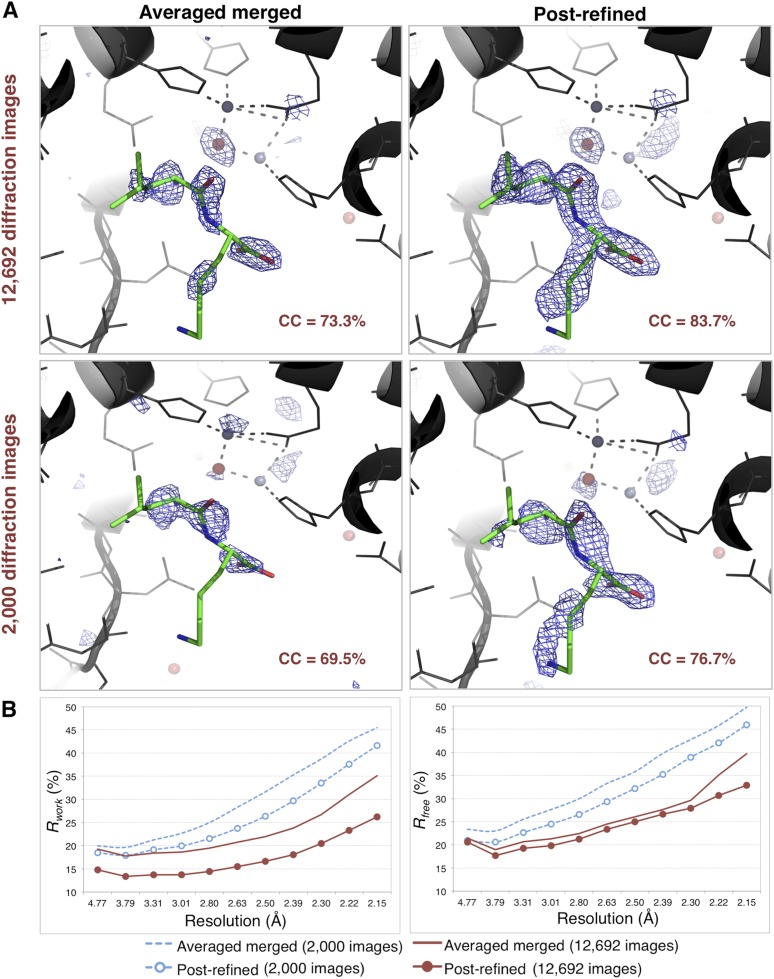
Figure 10. Impact of post-refinement on the quality of electron density maps and models of thermolysin.
(A) Difference Fourier (mFo-DFc) maps revealing a Leu–Lys dipeptide near the zinc site for the averaged merged and the post-refined thermolysin XFEL diffraction data sets consisting of all 12,692 diffraction images (Table 1) and a randomly selected subset of 2000 diffraction images, respectively. The maps are contoured at 3 σ. (B) Crystallographic R and Rfree values vs resolution for the refinements after atomic model refinement using the specified diffraction data sets and with inclusion of two zincs, calcium ions, and the Leu–Lys dipeptide.

