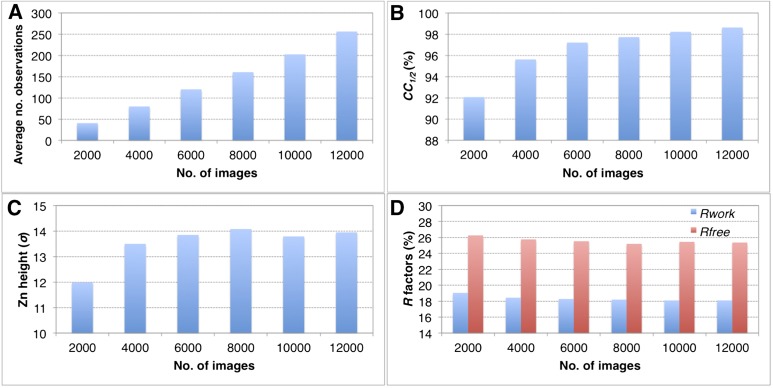
Figure 11. Convergence of structure refinements for the post-refined thermolysin XFEL data set at 2.6 Å resolution, using increasing numbers of diffraction images.
(A) Average number of observations per unique hkl. (B) CC1/2 for merged subsets using 2000–12,000 images (100% completeness for all subsets). (C) Peak height (σ) in the omit map for the largest peak. (D) Rwork and Rfree after refining the thermolysin model without zinc and calcium ions against the corresponding post-refined diffraction data sets.

