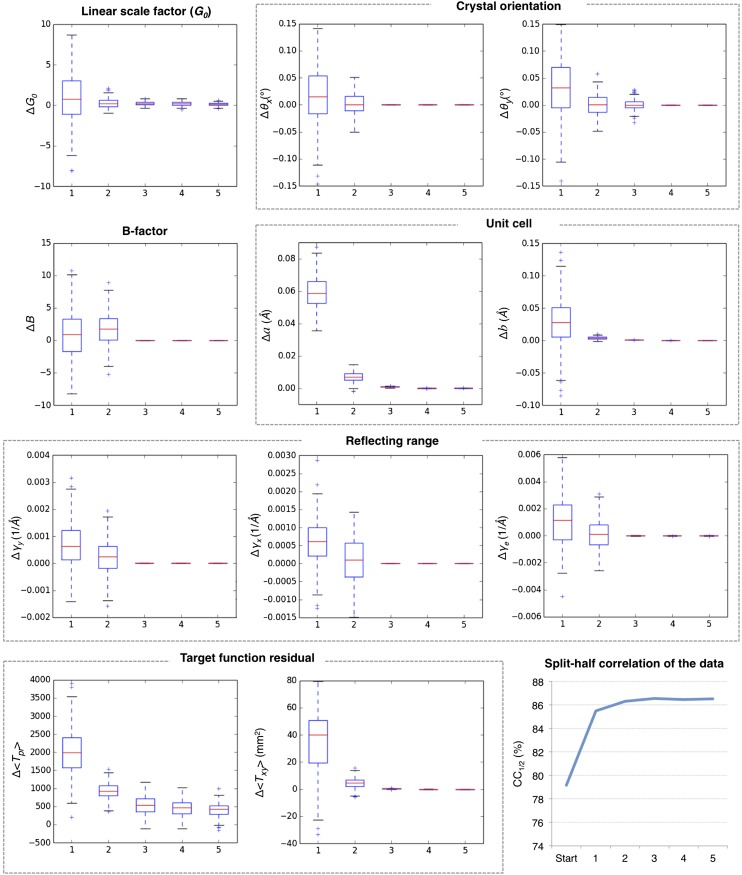
Figure 4. Convergence of post-refinement after five macrocycles for myoglobin.
The plots illustrate the convergence of post-refined parameters, target functions, and quality indicators during post-refinement over five macrocycles. A subset of 100 randomly selected diffraction images from the myoglobin XFEL diffraction data was used. For each specified target function and refined parameter, changes are plotted relative to the previous macrocycle, whereas the quality metric CC1/2 is shown as absolute numbers. The changes in post-refined parameters and target functions are shown as ‘box plots’. The bottom and top of the blue box are the first (Q1) and third (Q3) quartiles. The red line inside the box is the second quartile (Q2; median). The black horizontal lines extending vertically from the box indicate the range of the particular quantity at a 1.5 interquartile range (Q3–Q1). The plus signs indicate any items beyond this range.

