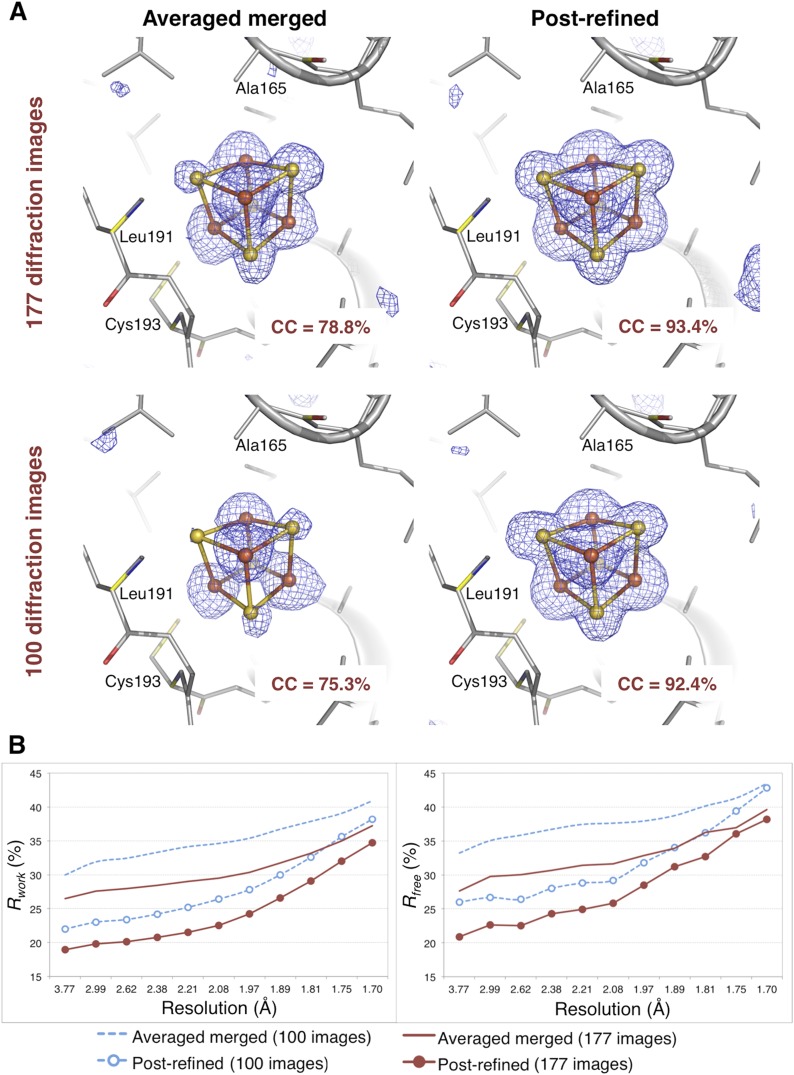
Figure 8. Impact of post-refinement on the hydrogenase diffraction data set.
(A) Difference Fourier (mFo-DFc) omit maps of one of the four Fe-S clusters (which were omitted in molecular replacement and atomic model refinement) for the averaged merged and the post-refined hydrogenase XFEL diffraction data sets consisting of all 177 diffraction images (Table 1) and a randomly selected subset of 100 diffraction images. The maps are contoured at 3 σ. (B) Crystallographic R and Rfree values vs resolution after atomic model refinement using the specified diffraction data sets with inclusion of the three Fe-S clusters and water molecules.

