. 2015 Apr 15;4:e05279. doi: 10.7554/eLife.05279

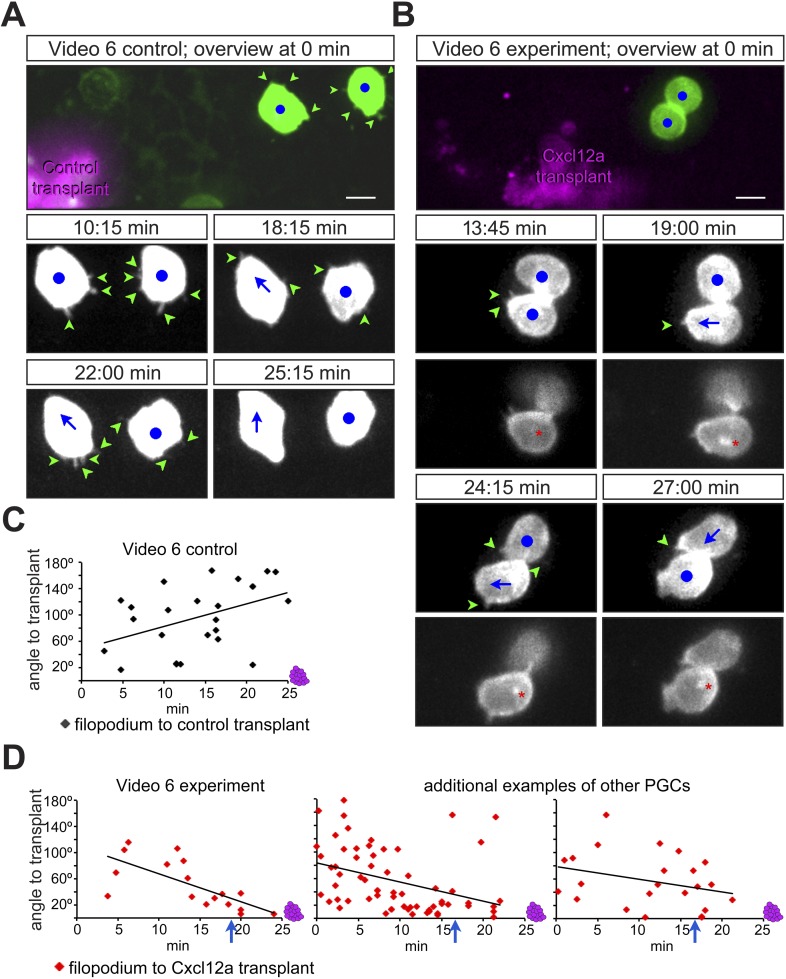
Figure 4. PGCs extend filopodia towards the chemokine source prior to cell polarization and directed migration towards the attractant.

(A, B) The cellular behaviour of PGCs (green) in response to transplanted control cells (magenta in A) or to Cxcl12a-expressing cells (magenta in B). Upper panels show the cells immediately after transplantation and lower panels show snapshots from Video 6 presenting the behaviour of the cells in the following 28 min. In B, additional images present the polar position of the golgi (red asterisk, labelled by EGFP-F', as defined in Figure 4—figure supplement 1A) at the back of the cell. Green arrowheads mark filopodia, blue dots indicate no migration and blue arrows show the direction of PGC movement. Scale bar is 10 µm. (C, D) The angle of filopodia orientation relative to the position of transplanted cells (located at 0°, see also Figure 4—figure supplement 1B) in the case of a control transplant (C) and with respect to Cxcl12a expressing transplant (D, three examples) over 25 min. Blue arrows signify the time of morphological cell polarization and movement.

DOI: http://dx.doi.org/10.7554/eLife.05279.018

Figure 4.

Figure 4—figure supplement 1. Polarization of PGCs encountering an artificially generated Cxcl12a gradient.

Figure 4—figure supplement 1.

(A) Schematic experimental setup. Cells from 4 hpf medNY054 homozygous embryos expressing Cxcl12a and mCherry-F', in which Cxcr7b expression was inhibited, were transplanted into 6 hpf medNY054 homozygous embryos to examine the response of PGCs to the chemokine gradient. Control cells were similarly labelled but lacked Cxcl12a expression. The image to the right shows a polarized PGC with F-actin at the cell front labelled by Lifeact-EGFP (magenta) and the golgi apparatus at the cell back labelled with ECFP- tagged human beta1,-4-galactosyltransferase (yellow). The mCherry-F' labels the cell membrane, as well as the area of the golgi at the back of the cell. (B) A schematic representation of the angle measurements presented in Figure 4C,D for filopodia orientation relative to the position of the transplanted cells (located at 0°).
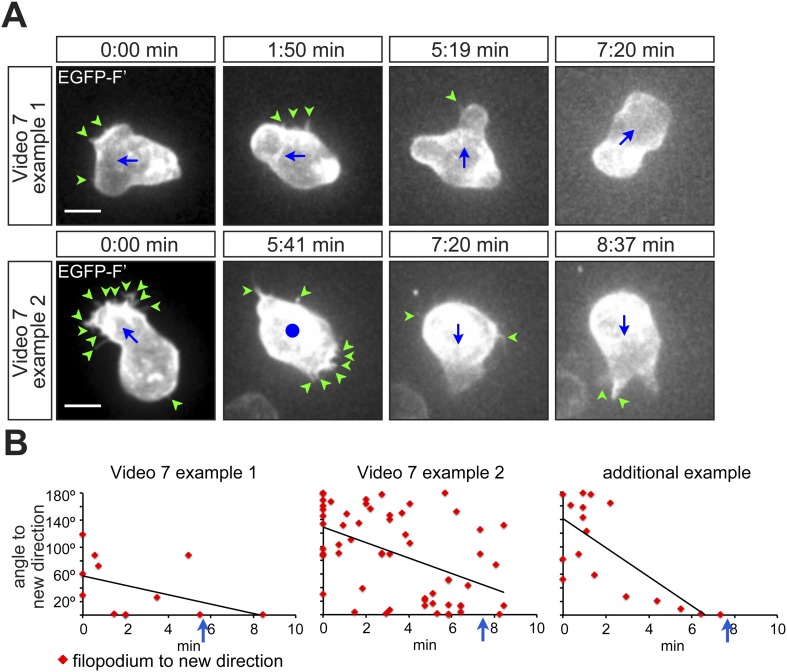
Figure 4—figure supplement 2. PGCs extend filopodia in the direction of migration prior to polarization and actual onset of migration.

Figure 4—figure supplement 2.

(A) Snapshots from Video 7 presenting the behaviour of a migrating cell, which makes a 90° turn (upper panel) and of a cell, which depolarizes and then migrates in the opposite direction (lower panel). Green arrowheads mark filopodia; blue dot indicates no migration and blue arrows show the direction of PGC movement. Scale bar signifies 10 µm. (B) Filopodia orientation relative to the forthcoming direction of migration (located at 0°) in the two cells presented in Video 7. An additional example is presented on the right. Blue arrows signify the time of morphological cell polarization and migration.