Figure 6. irsp53 RNA expression, Irsp53 protein localization and the role of the protein in filopodia formation.
(A) Schematic structure of the Irsp53 protein domains. The position of the mCherry fluorophore fusion at the C-terminus of the protein is presented, proteins interacting with the SH3 and CRIB domains are indicated and the mutations introduced into the I-BAR domain to generate the dominant-negative (DN) Irsp53 version are marked. (B) Ubiquitous expression of the irsp53 RNA in 1, 6 and 10-hpf embryos. (C) A single plane of PGCs expressing EGFP-F' and an Irsp53-mCherry protein fusion showing localization of Irsp53 to filopodia (upper panel), while the dominant-negative Irsp53 protein is not found in the filopodia (lower panel). Rectangles delineate the area of magnification shown in the right panels. (D) Reduction of filopodia number at the cell front in PGCs in wild type embryos expressing the DN Irsp53 protein (dark bars) relative to control PGCs (light bars). ‘n’ indicates the number of cells analysed. (E) Examples of a control (left) and a dn irsp53-expressing (right) PGCs in wild type embryos. (F) Expression of dn irsp53 in PGCs of medNY054 homozygous embryos shows no effect on filopodia number and distribution around the cell perimeter (dark bars) as compared with control PGCs (light bars). (G) Examples of a control (left) and a dn irsp53-expressing (right) PGCs in medNY054 homozygous embryos. ‘n’ indicates the number of cells analysed, arrows show direction of cell migration and arrowheads mark filopodia. Scale bar is 10 µm.

Figure 6—figure supplement 1. Irsp53 localization within filopodia.

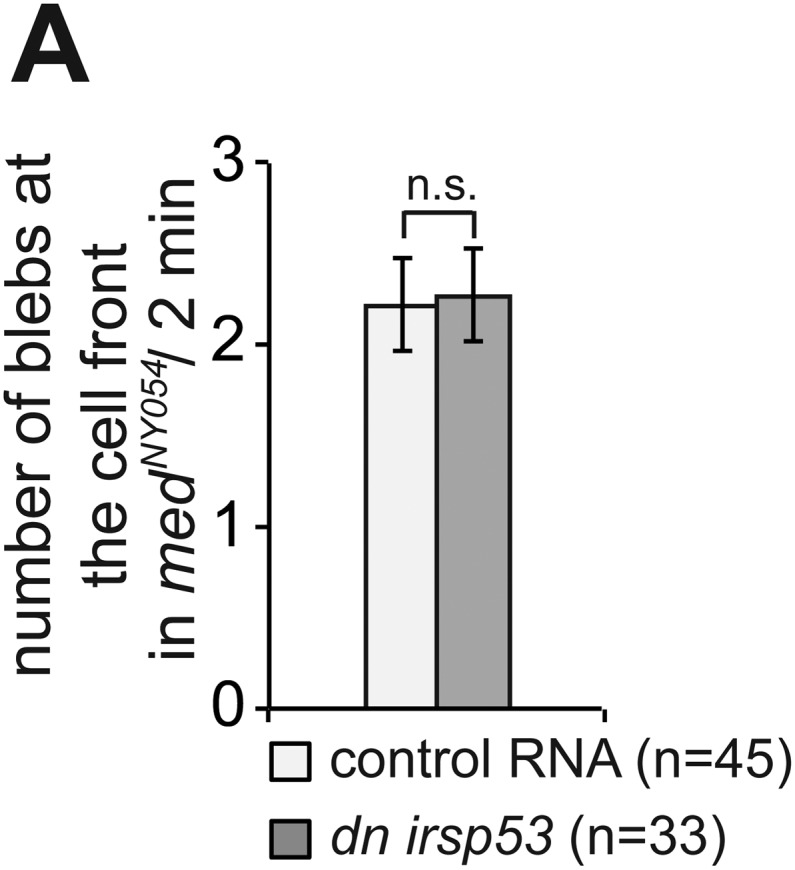
Figure 6—figure supplement 2. Inhibition of Irsp53 does not affect bleb formation at the cell front.