. 2015 Apr 15;4:e05279. doi: 10.7554/eLife.05279

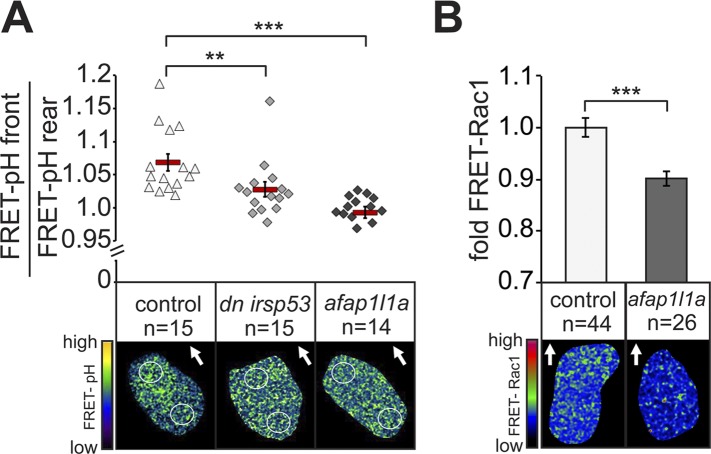
Figure 8. Filopodia are required for cellular response to polarized Cxcl12a distribution.

(A) 6–7 hpf control PGCs exhibit polarized distribution of intracellular pH as determined by the FRET efficiency of the pH sensor pH-lameleon5 protein in the cells (left). Expression of the dominant negative form of Irsp53 or overexpression of the Afap1L1a abrogates the formation of high pH in the front. The graph represents average pH-FRET ratios between the front and the rear (as indicated by the circles). The values for each cell are averages of 20 time points. (B) 8–9 hpf PGCs overexpressing Afap1L1a exhibit a decrease in Rac1 activity, as determined by differences in FRET generated by a Rac1-FRET activity reporter. Arrows indicate the direction of movement. ‘n’ indicates the number of cells analysed.

DOI: http://dx.doi.org/10.7554/eLife.05279.033

Figure 8.

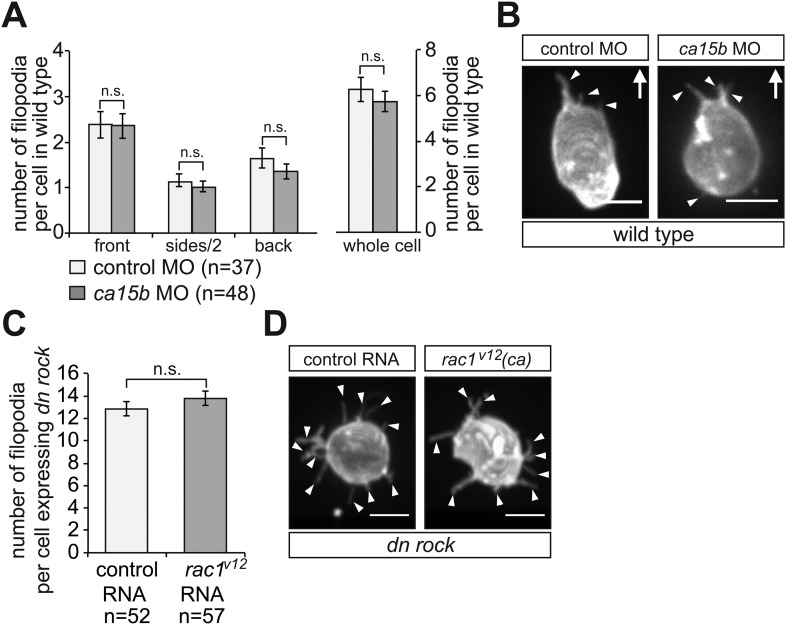
Figure 8—figure supplement 1. Filopodia formation is independent of the elevated pH at the cell front and of Rac1 activity in migrating PGCs.

Figure 8—figure supplement 1.

(A) PGCs in embryos knocked down for ca15b (dark bars) show similar distribution and number of filopodia to that of control cells (light bars). (B) Examples of a control (left) and ca15b -knocked down PGCs. Arrows indicate the direction of movement. (C) The number of filopodia in control (light bar) and in PGCs expressing constitutive active (ca) rac1 (rac1V12) (dark bar) is similar. Since cells expressing the activated version of Rac1 are immotile, we immobilized both control and experimental cells by DN Rock expression, so the cells can be compared with respect to filopodia formation. (D) Representative images of a control (left) and a rac1V12 expressing PGCs. Arrowheads indicate filopodia. ‘n’ indicates the number of cells analysed. Scale bars signify 10 µm.