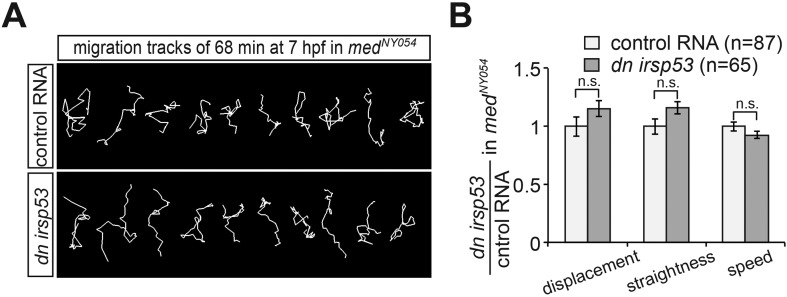
Figure 9. Manipulations of filopodia formation lead to PGC migration defects.
(A) Representative migration tracks of control PGCs (upper panel) and PGCs expressing the dominant-negative (dn) irsp53 version (lower panel). (B) Analysis of PGC migration tracks assessing displacement, straightness and migration speed, comparing control cells (light bars) with dn Irsp53-expressing cells (dark bars). ‘n’ indicates the number of migration tracks analysed. (C) Representative migration tracks of control PGCs (upper panel) and PGCs overexpressing (oex) afap1L1a (lower panel). (D) Analysis of PGC displacement, track straightness and migration speed, comparing control cells (light bars) with afap1l1a overexpressing cells (dark bars). ‘n’ indicates the number of migration tracks analysed. (E–H) Expression of the dn irsp53 (E, F) or overexpressing afap1l1a (G, H) in PGCs results in an increase of ectopic cells at 24 hpf as compared with embryos whose PGCs express a control RNA. ‘n’ indicates the number of embryos analysed. Arrowheads point at ectopic PGCs and asterisks mark the site of the developing gonad.


