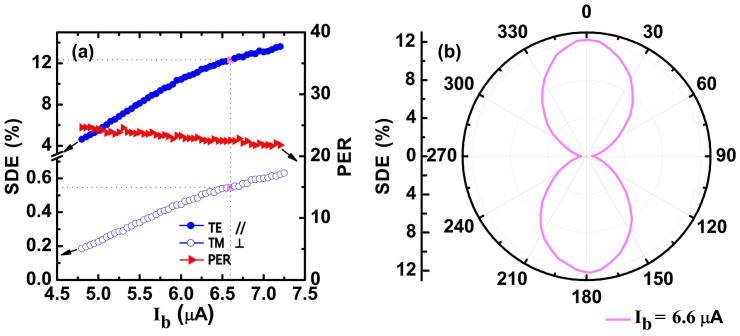
Figure 3. Measurement results of SNSPD.
(a) SDE and PER as functions of bias current. The blue solid and hollow dots represent the SDE for TE and TM waves, respectively. The PER, represented by the red triangles, is calculated from the SDE data for two different polarizations. (b) The polarization dependence of SDE in the polar coordinate system at a dark count rate of 100 Hz.

