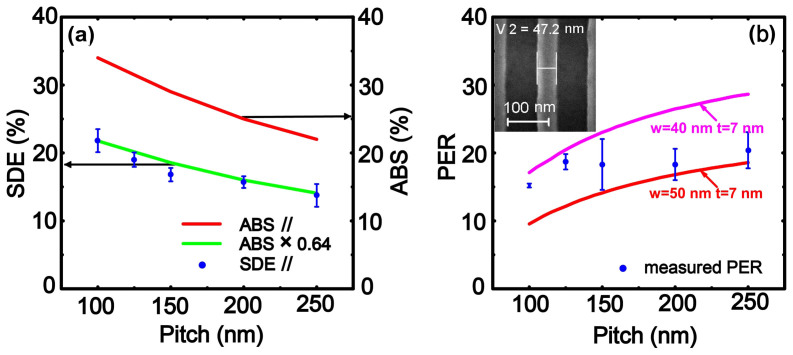
Figure 4. Comparison and analysis of 16 SNSPDs with different pitches.
(a) Plot of SDE and ABS for the TE wave as a function of the pitch. The blue dots represent the measured SDEs of the devices. The error bar indicates the standard deviation of the SDEs for SNSPDs with the same pitch. The red line represents the calculated absorptance, and the green line shows the estimated SDE from the absorptance curve considering a loss factor of 0.64. (b) Comparison of the measured PERs (blue scattered dots) with the calculated PER as a function of pitch. The red and pink lines represent linewidths of 50 and 40 nm, respectively. The inset presents an SEM image of a typical nanowire, revealing a linewidth of 47.2 nm. The error bar indicates the standard deviation of the PERs for SNSPDs with the same pitch.

