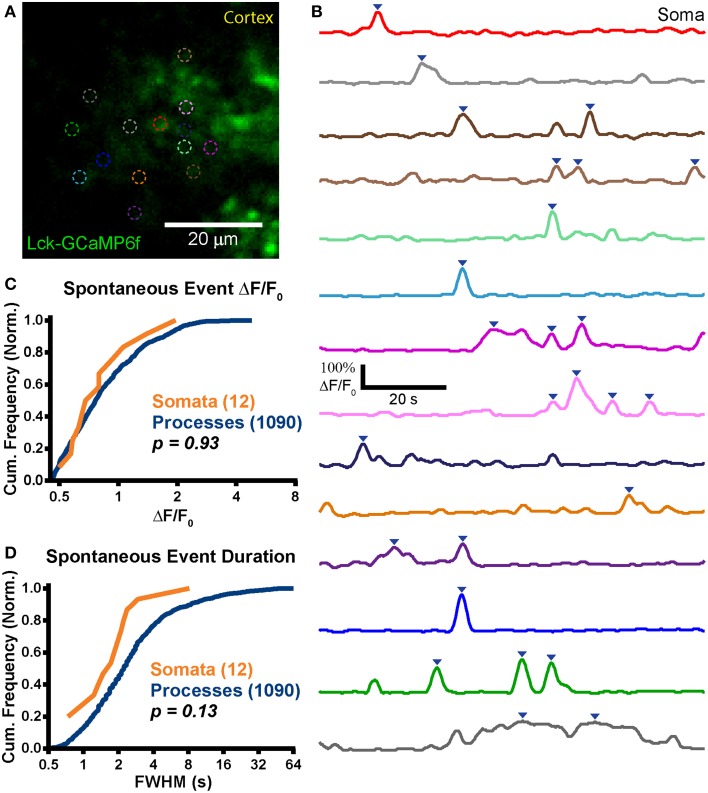
Figure 6.
Stable expression in adult animals. (A) Example mean calcium activity projection image of a cortical astrocyte expressing Lck-GCaMP6f in an acute brain slice obtained from a P125 rat. As in Figures 4, 5, ROIs are denoted by dashed circles. (B) ΔF/F0 traces of ROIs shown in (A). Line colors in (B) correspond to dashed circle colors in (A). Inverted blue arrows mark peaks that reached threshold and were included as events for analysis. “Merged” events were counted as a single long event (see dark gray ROI). (C) A cumulative histogram displaying the relative frequency (event counts normalized by total events in each structure) of spontaneous event peak ΔF/F0 values. The total events in each structure is shown in parentheses next to the structure name. (D) A cumulative histogram displaying spontaneous event duration. Soma data is shown in orange and process data in blue. The distribution of each measurement was compared between somas and processes. The calculated p-value from a Kolmogorov–Smirnov test is shown in the plot. Red text denotes significance and black text denotes no significance detected at a level of p < 0.05.

