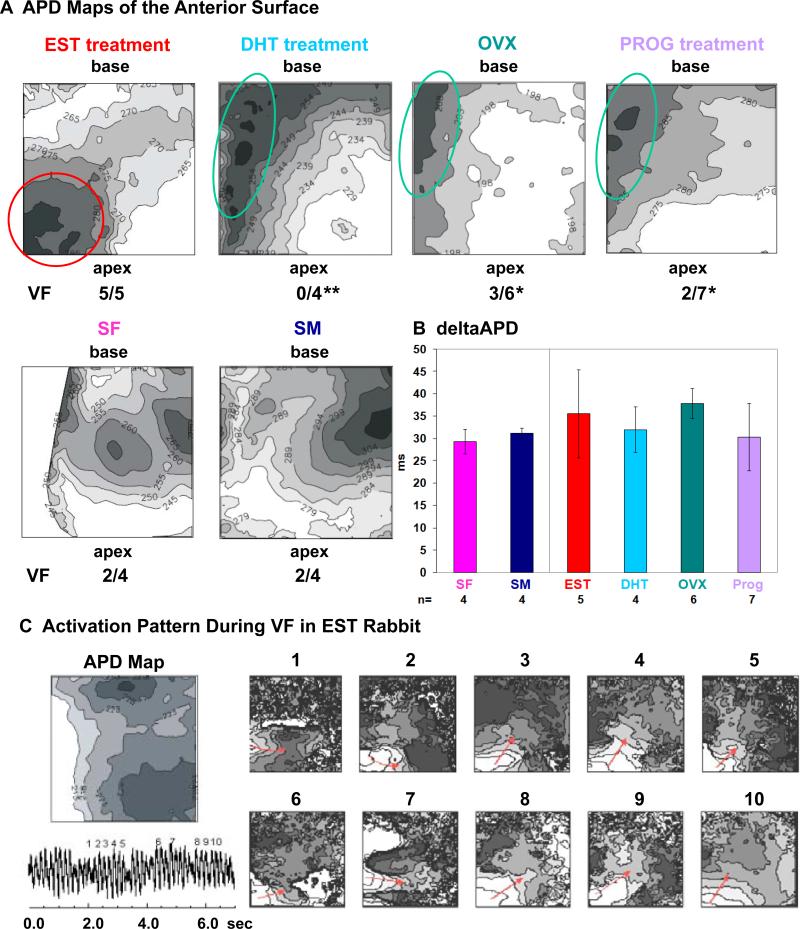
Figure 4. Effect of Sex Hormones on APD Dispersion.
A. Representative APD maps of the anterior surface of the LV (field of view 1.5 x 1.5 cm2) of individual rabbits. Isolines of APD are drawn every 5 ms, darker regions represent longer APD. Indicated are regions of long APD in LV mid-base region (green circle) and LVapex (red circle). Rates of VF inducibility are listed. * p<0.05, ** p<0.01. B. ΔAPD defined as longest – shortest APD. All values are shown as mean ± SD. C. Activation pattern during VF in EST rabbit. Displayed are APD map, ECG trace of VF (bottom left), and consecutive maps (1-10) of the activation pattern during VF. Red arrows indicate the direction of activation waves rotating around the apical region of prolonged APD.

