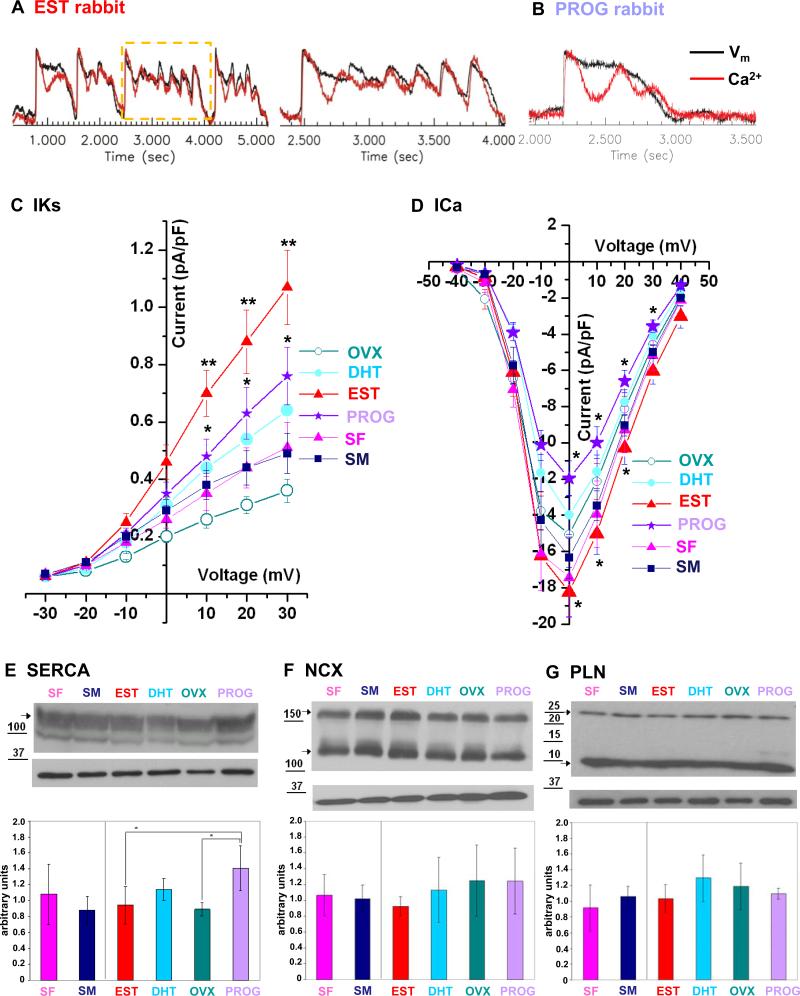
Figure 5. Effect of Sex Hormones on Ca2+ Oscillations, EADs, Ion Currents, and Ca2+ Cycling Proteins.
A. Representative trace of Ca2+ oscillations and EADs in EST rabbit after ISO bolus. Black line indicates changes in voltage fluorescence signal (Vm); red line indicates changes in Ca2+ signal. The region shown in higher magnification in the right column is indicated by a yellow rectangle. B. Representative trace of Ca2+ oscillations and lack of EAD formation in PROG rabbit after ISO bolus. C.-D. Hormones effects on IKs and ICa,L current densities measured in cardiomyocytes harvested from LVapex of EST (n=15 cardiomyocytes), DHT (n=14), OVX (n=15), PROG (n=18), SF (n=6), and SM (n=6) rabbits. All values are shown as mean ± SEM. IKs: EST vs. OVX: p<0.01; EST vs. PROG, PROG and DHT vs. OVX p<0.05. ICa,L: EST vs. OVX, PROG vs. OVX: p<0.05; EST vs. PROG: p<0.01. E.-G. Representative western blots of SERCA2a, NCX, and PLN. Bar graphs indicate the expression levels of 3 independent experiments in 3 different rabbits per group in arbitrary units. All values are shown as mean ± SD. * p<0.05.

