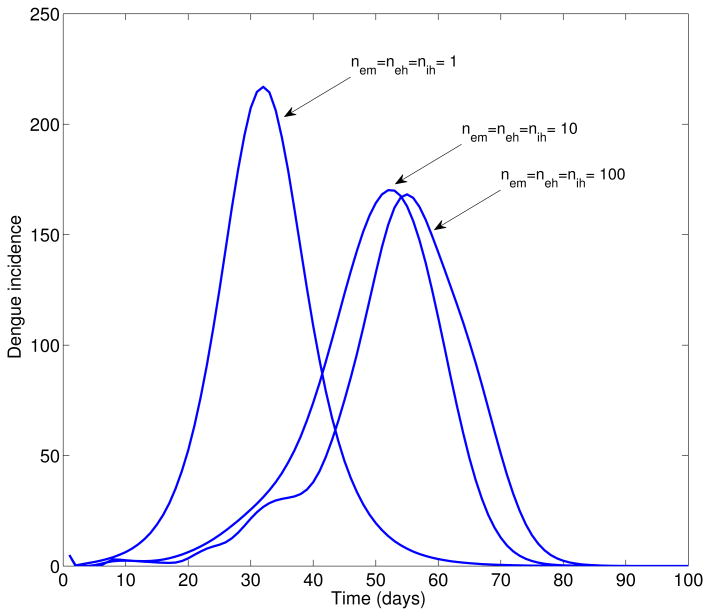
Figure 1.
Simulated deterministic dengue epidemics according to the epidemiology of dengue (Table 1, basic reproduction number, ℛ0 = 24), the population size of Easter Island, a baseline average of 3 mosquitoes per person, and changing variance of the distribution of the extrinsic incubation period, the intrinsic incubation period, and the infectious period in humans. Overall the time from epidemic onset to peak increases with decreasing variance in the distribution of epidemiological parameters. Nem = neh = nih = 1 corresponds to exponentially distributed (largest variance) extrinsic incubation period, the intrinsic incubation period, and the infectious period and the Nem = neh = nih = 100 model fixed distributions (zero variance) of these epidemiological parameters. Notice that as the variance decreases, the epidemic is delayed and the peak incidence decreases.

