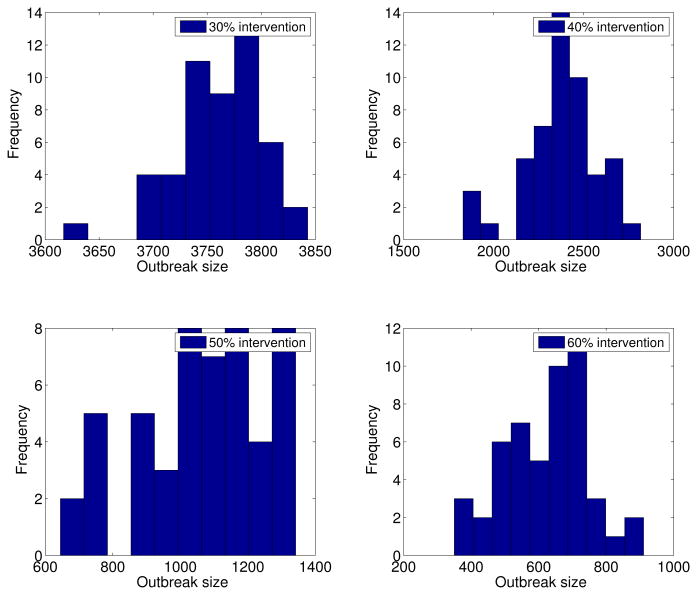
Figure 6.
Dengue outbreak size distribution according to intensity of reactive control interventions. Final outbreak size histograms were obtained from stochastic epidemic simulations (model 2) according to the epidemiology of dengue (Table 1, basic reproduction number, ℛ0 = 24), the population size of Easter Island, a baseline average of 3 mosquitoes per person, and reductions of 30% to 60% in mosquito density and the baseline transmission rate between mosquitoes and hosts following the start of control interventions on March 16th, 2002.

