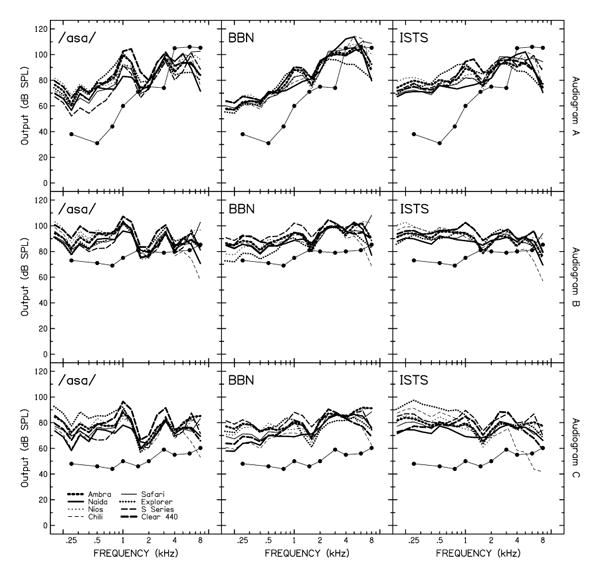
Figure 3.

The average output in dB SPL from each hearing aid when measured with each audiogram and stimulus. The maximum audible frequency can be obtained by finding the highest point where the audiogram intersects with the average hearing aid output and drawing a vertical line.
