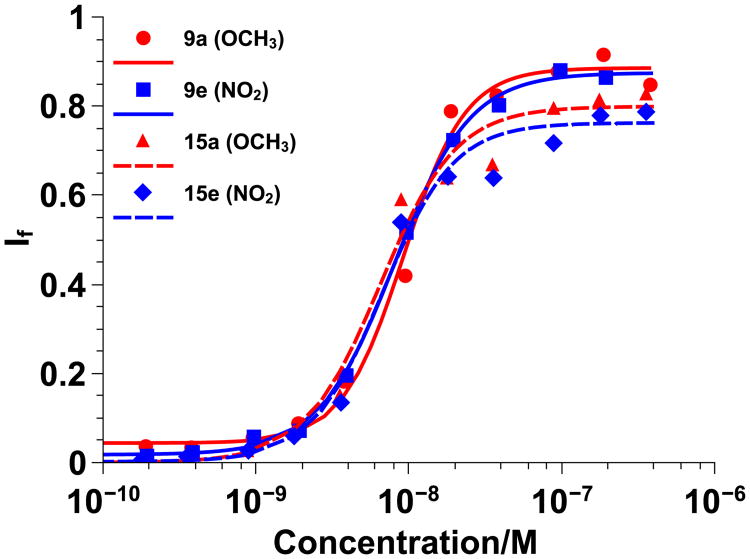
Figure 4.
Homopolymer vs. random copolymer Hill plots for π-rich polymers 9a and 15a (red) and π-poor polymers 9e and 15e (blue) using 100 nm PC large unilamellar vesicles swelled with carboxyfluorescein. Data was fit to the Hill Equation and If represents the fraction of dye released. Solid lines represent diester homopolymers and dashed lines represent diester random copolymers.

