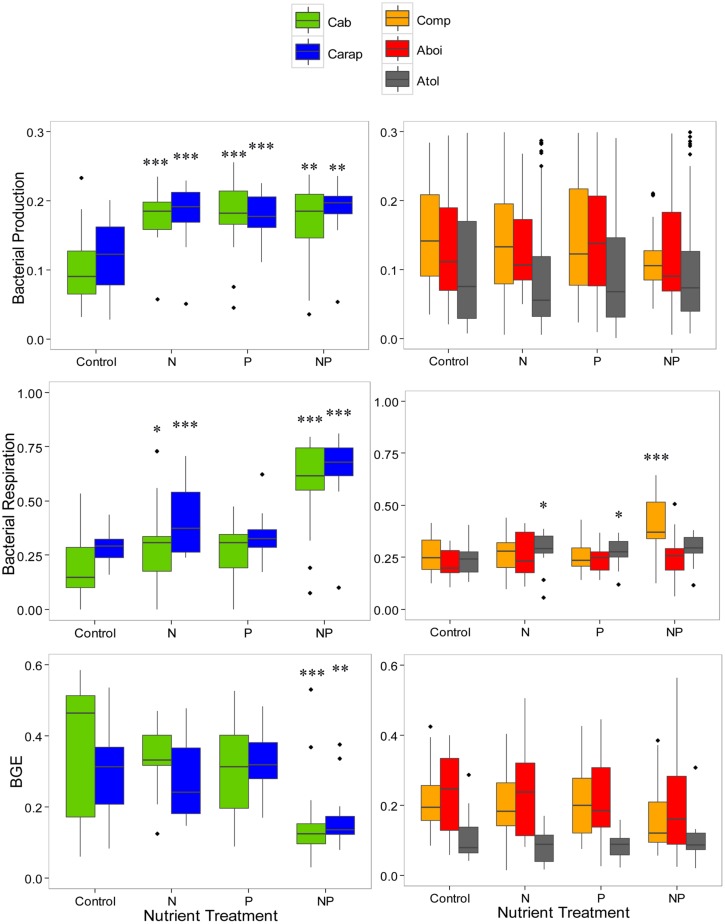
FIGURE 2.
Bacterial respiration (upper), bacterial production (middle), and BGE, lower) in relation to different nutrient additions in five humic tropical lagoons. Lagoons were grouped in different panels based on the bacterial responses to nutrient additions. Panels on the left show data from the lagoons with lower carbon concentrations (Cabiunas – Cab, Carapebus – Carap) while panels on the right show data from the lagoons with higher carbon concentrations (Comprida, Comp, Amarra-Boi – Aboi, Atoleiro – Atol). Control – no nutrient addtion, N – nitrogen addition, P – phosphorus addition, and NP – nitrogen and phosphorus additions. Asterisks indicates a significant difference in response of bacterial metabolism to nutrient additions compared with the control for each lagoon (*p < 0.05, **p < 0.01, ***p < 0.001). Note that no comparison between lagoons is showed here.

