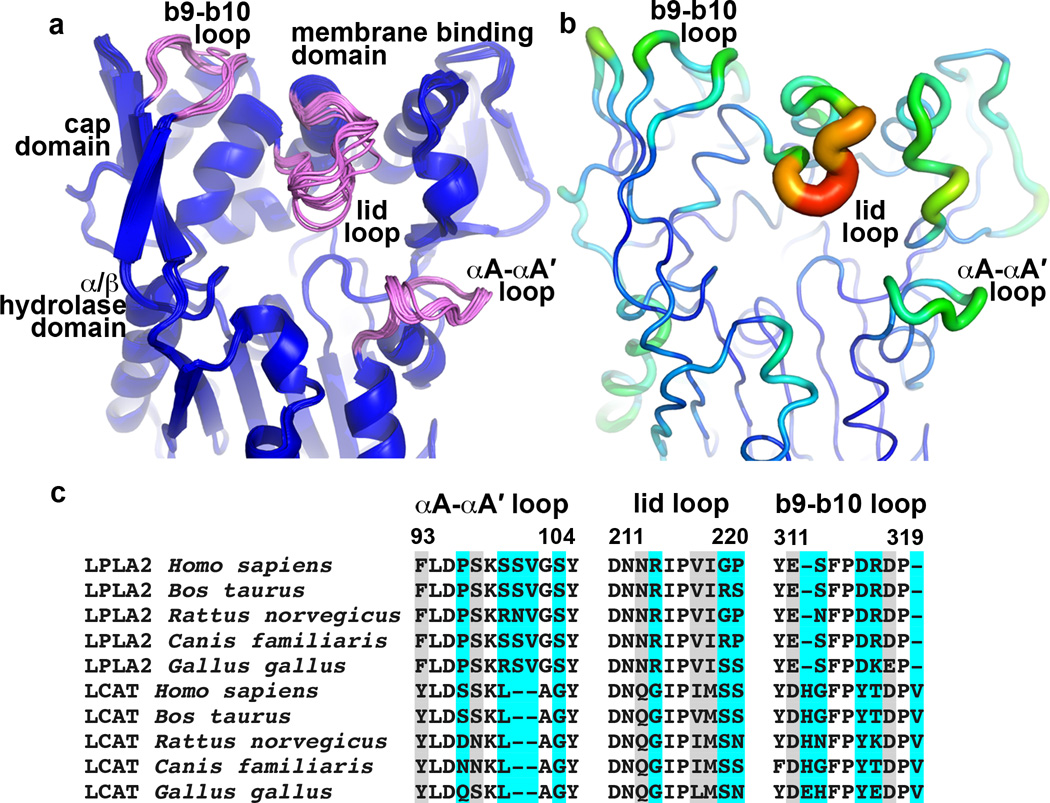
Figure 5.
Conformational and sequence variability in LPLA2. (a) Structural alignment of 16 unique LPLA2 chains from all of the unique LPLA2 crystal forms (Table 1 and Supplementary Tables 1–2). Loops with highest RMSD scores (b9-b10 loop and lid loop of cap domain, and αA-αA´ of catalytic core) are shown in pink. (b) Temperature factor distribution is consistent with the conformational variability in panel A. Chain A of the ligand free LPLA2 structure with B-factors indicated by color (blue to red, 13 to 44 Å2) and by width of the Cα trace. (c) Sequence alignment of the most flexible LPLA2 loops with those of LCAT from the same species. Cyan and grey highlights indicate positions that are variable and highly conserved between LPLA2 and LCAT subfamilies, respectively. No highlight indicates invariance.

