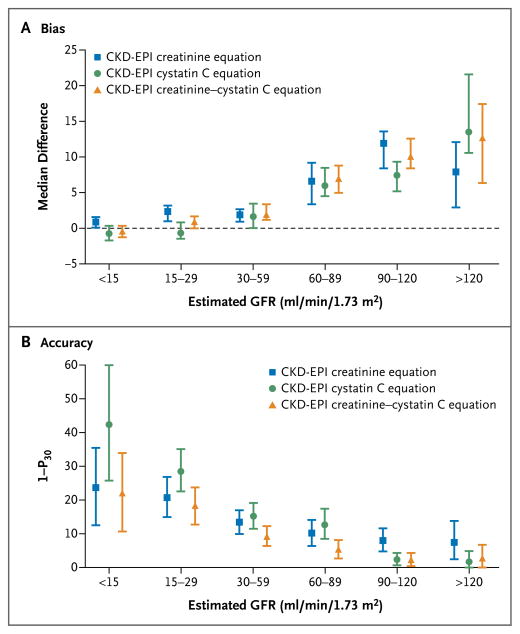
Figure 1. Performance of Three Equations for Estimating Glomerular Filtration Rate (GFR).
Panel A shows the median difference between measured and estimated GFR. The bias is similar with the equation using creatinine alone, the equation using cystatin C alone, and the combined creatinine–cystatin C equation. Panel B shows the accuracy of the three equations with respect to the percentage of estimates that were greater than 30% of the measured GFR (1 – P30). I bars indicate 95% confidence intervals.

