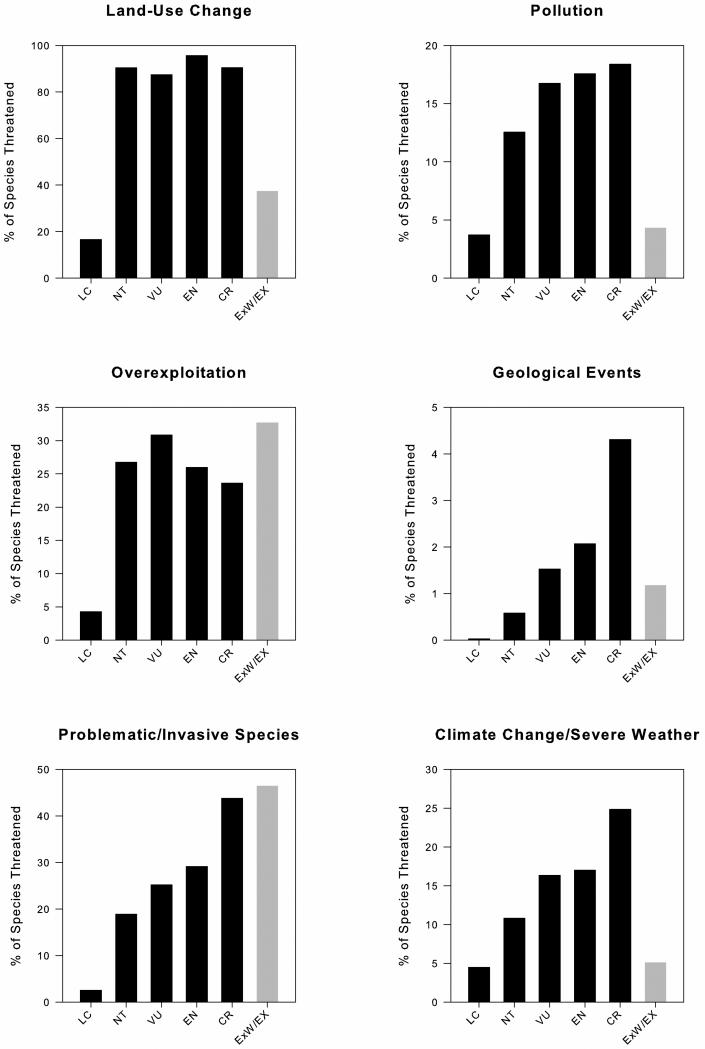
Figure 2.
The proportion of species affected by six major threats in IUCN Red List: LC=Least Concern, NT=Near Threatened, VU=Vulnerable, EN=Endangered, CR=Critically Endangered, ExW/Ex=Extinct in the Wild and Extinct. Proportions were calculated using the number of species threatened divided by the total number of species in each corresponding status category. Extinct species are shaded because they are excluded from statistical analyses and because they are categorically different from other Red List status categories (see Methods). CTA showed tha proportions significantly varied between Red List status categories for each of the six drivers of extinction: land-use change (χ2= 9425.8, p<0.0001), overexploitation (χ2=2193.6, p<0.0001), invasive species (χ2= 3151.61, p<0.0001), pollution (χ2= 938.4, p<0.0001), geological events (χ2= 368.9, p<0.0001), and climate change/severe weather (χ2= 917.68 p<0.0001).

