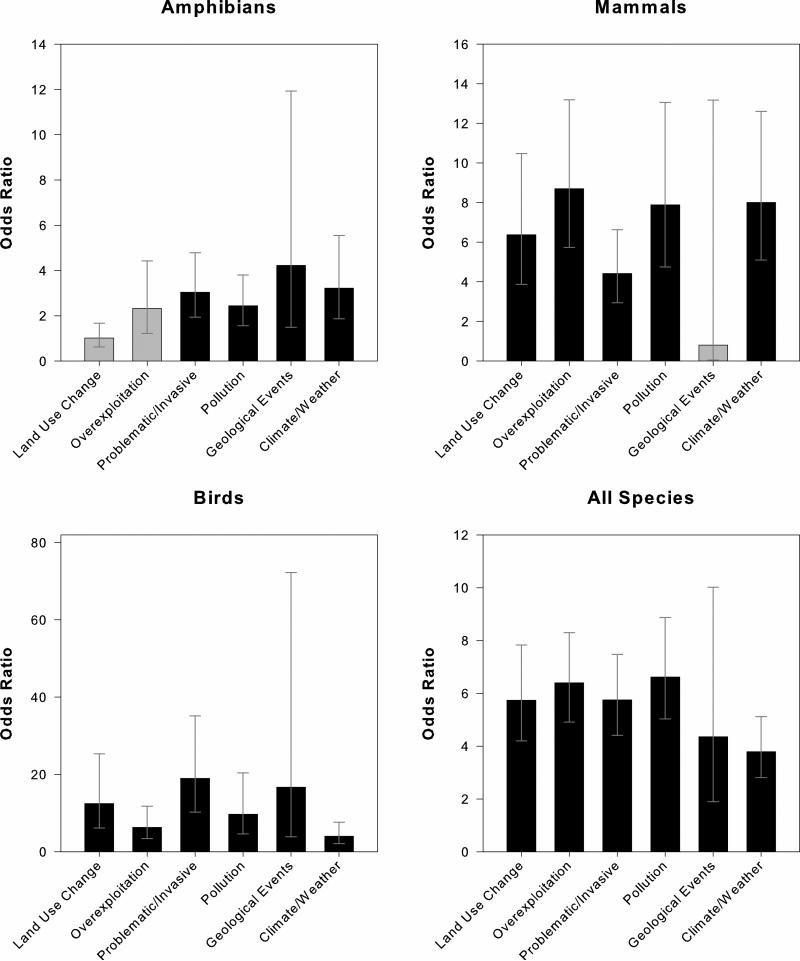
Figure 3.
Odds ratios and confidence intervals showing the increase in likelihood of having disease co-occur with each of the six other major threats. Odds ratios greater than one indicate that there is an increased likelihood of having disease also occur as a threat than compared to when the threat is absent. Odds ratios were calculated for each of the six threats using the following example formula for land-use change: (# of species threatened by disease and land-use change divided by # of species not threatened by disease, but threatened by land-use change) divided by (# of species threatened by disease, but not by land-use change divided by # of species not threatened by disease or land-use change). Black bars correspond to statistically significant odds ratios, whose confidence intervals exclude 1.0, (p<0.05) as determined by Fisher's Exact Test, while grey bars represent non-significant results.

