Fig. 4.
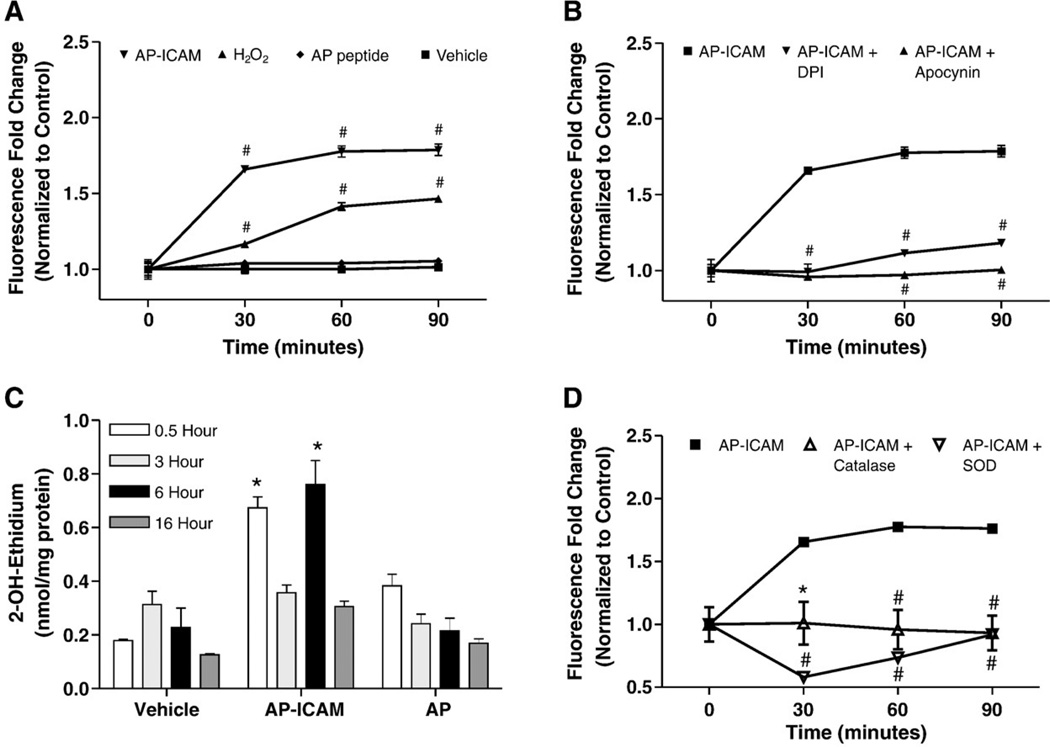
The cytoplasmic tail of ICAM-1 increases cellular ROS production. (A) DCF assay showing increased ROS production in response to AP-ICAM treatment over time compared to AP peptide, hydrogen peroxide (50 µM), and vehicle treatments. (B) Changes in DCF fluorescence between AP-ICAM-treated cells and AP-ICAM treatment plus DPI (1 µM) or apocynin (100 µM). (C) HPLC measurement of superoxide formation from 2-OH-ethidium levels after various peptide treatments at different time points, which were compared to respective time controls. (D) Changes in DCF fluorescence between AP-ICAM and AP-ICAM plus PEG–SOD (400 units/ml) or PEG–catalase (100 units/ml). n=4; #p<0.001, *p<0.01; DCF experiments performed in quadruplicate and 2-OH-ethidium experiments were performed in duplicate.

