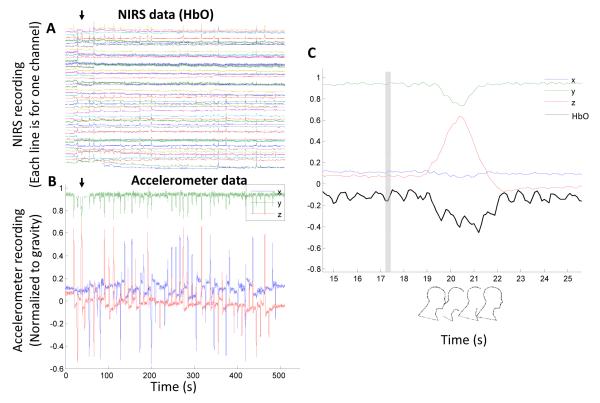
Figure 2.
Exemplary NIRS and accelerometer data. (A) A participant’s NIRS data (HbO from 48 channels). Rows from bottom to top are for channel 1 to 48. It’s evident that there are numerous motion artifacts (spikes). The black arrow indicates one of such spikes. (B) The same participant’s accelerometer data showing the subject’s head position. Because the head motion is slow compared to gravity (i.e. the linear acceleration is negligible), the accelerometer data recorded is the x-, y-, and z-components of gravity in the reference frame of the smartphone. The black arrow indicates one of the head motions and the timing is identical to the arrow in (A). (C) A zoom in of accelerometer data of the first head motion (“forward big”), and the HbO signal from channel 1. The vertical gray bar indicates the timing of motion instruction.

