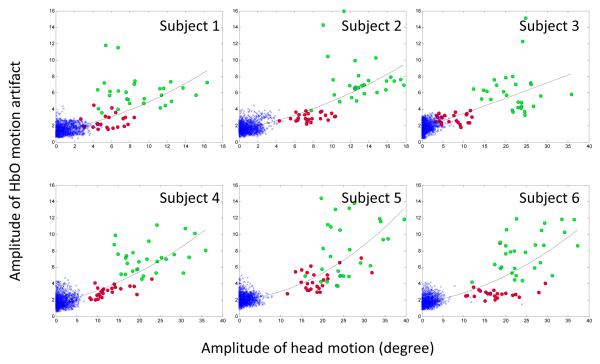
Figure 4.
Amplitude of HbO artifacts as a function of the amplitude of head motion. The x-axis gives the amplitude of the head motion (unit= degree), the y-axis gives the amplitude of the maximal HbO motion artifacts (normalized by the pooled standard deviation). Green circles denote “long” motion and red circles denote “short” motion. The blue cross (x) symbols are data from the “non-motion” period where the subjects were instructed to remain still. The trend line within each subplot highlights a very strong non-linear dependence on head motion. The fit of the quadratic (i.e., non-linear) term was significant for all participants except Subject 3. Bigger motion is clearly related to bigger HbO artifacts.

