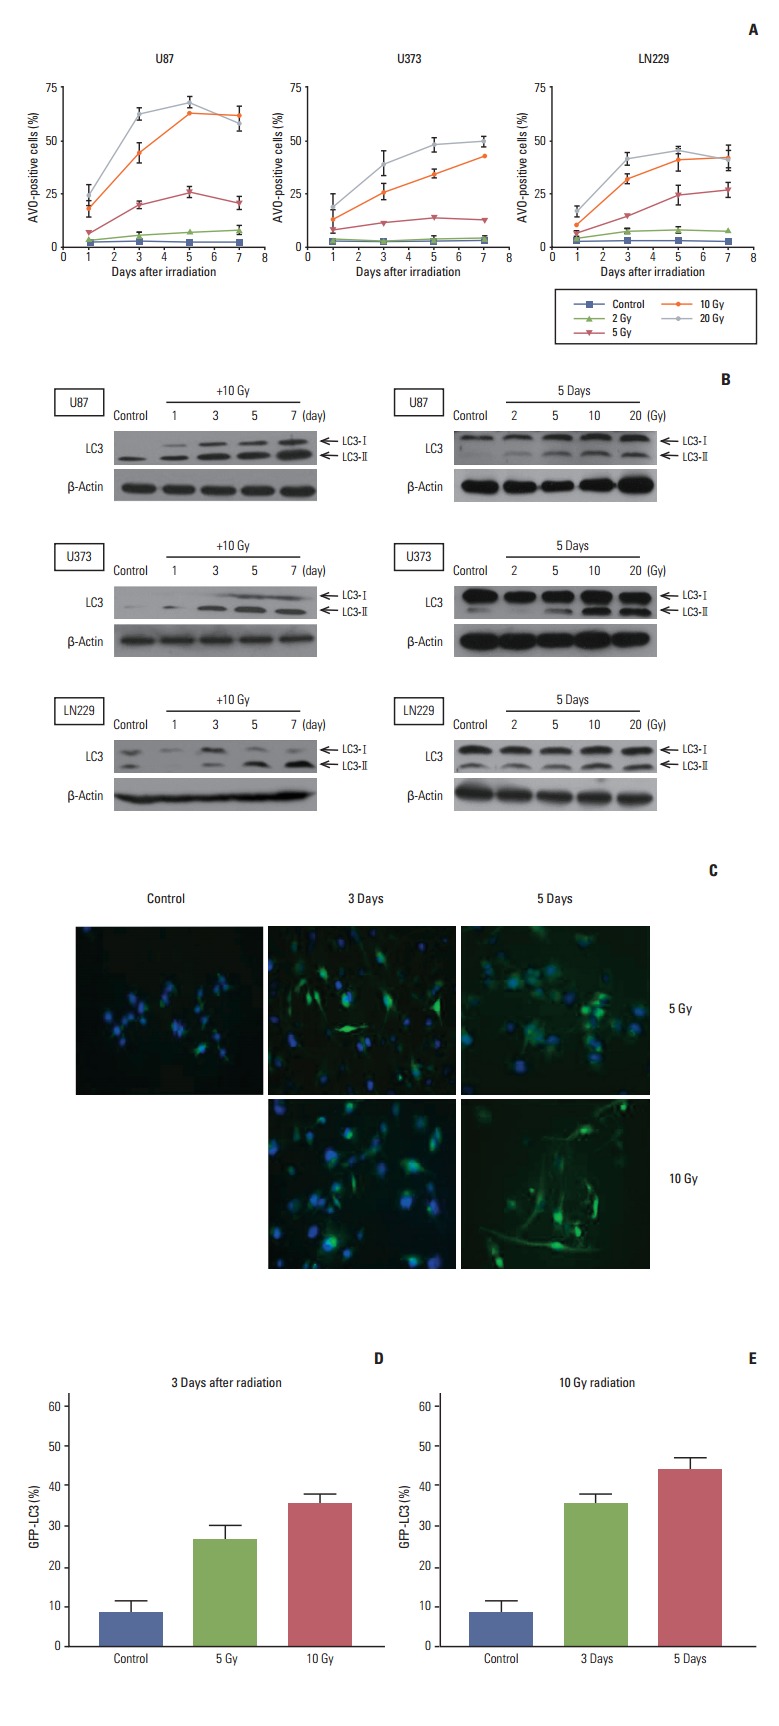
Fig. 2.

Analysis of autophagy after radiation according to time and radiation dose. (A) Glioma cells were irradiated with different doses of radiation and then incubated for the indicated times. To measure acidic vesicular organelle (AVO), which is indicative of autophagy formation, cells were stained with acridine orange and analyzed quantitatively by flow cytometry. Data from three independent experiments were combined. The error bars indicate ±standard error of mean. (B) Western blot analysis of LC3 according to time and radiation dose. Western blotting of LC3 generated two separate bands (an upper one of 18-kDa for LC3-bI and a lower one of 16-kDa for LC3-bII). An increase in the lower band accompanied by an increase in the ratio of the lower to the upper band is indicative of autophagy. Each membrane was stripped and re-blotted with β-actin to confirm equal loading. (C) U373 cells stably expressing GFP-LC3 revealed an increase of LC3 dots from 5 to 10 Gy and from 3 to 5 days (×200). Cells bearing GFP-LC3 puncta, which were quantified and averaged from 10 high-power fields, showed a dose-dependent increase at 3 days after irradiation (D) and an increase from 3 to 5 days after irradiation at 10 Gy (E).
