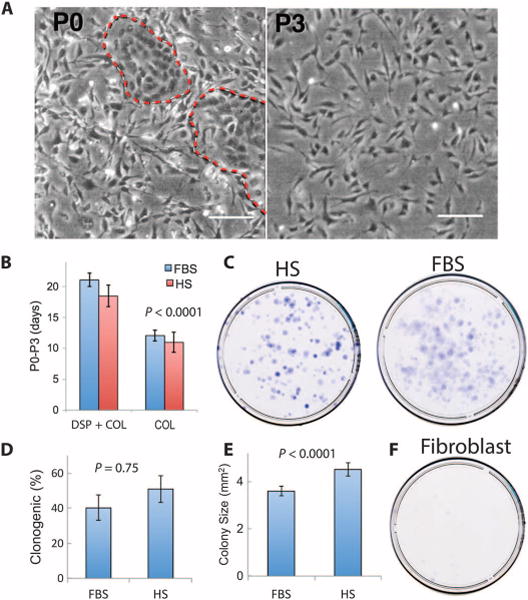
Fig. 1. Ex vivo expansion and clonogenicity of limbal biopsy stromal cells.

(A) Phase-contrast images of primary cells cultured from limbal biopsy tissue prepared by digestion with collagenase only. In initial plating (P0), red dashed lines mark islands of epithelial cells. Scale bars, 50 μm. (B) The length of time (in days) required to expand cells from P0 to P3 was compared for LBSCs prepared with dispase and collagenase (DSP + COL) or collagenase only (COL), expanding cells in either HS or FBS. Data are means ± SD (n = 4). P value determined by two-way analysis of variance (ANOVA). (C) Clonal growth of LBSCs in HS and FBS. (D) Percentage of clonogenic cells in P3 cultures. Data are means ± SD (n = 4). (E) Colony size was calculated with Fiji image analysis software. Data are means ± SD (n > 400). P values in (D) and (E) were determined by a two-sided t test. (F) Corneal fibroblasts in FBS did not exhibit clonal growth (n = 4).
