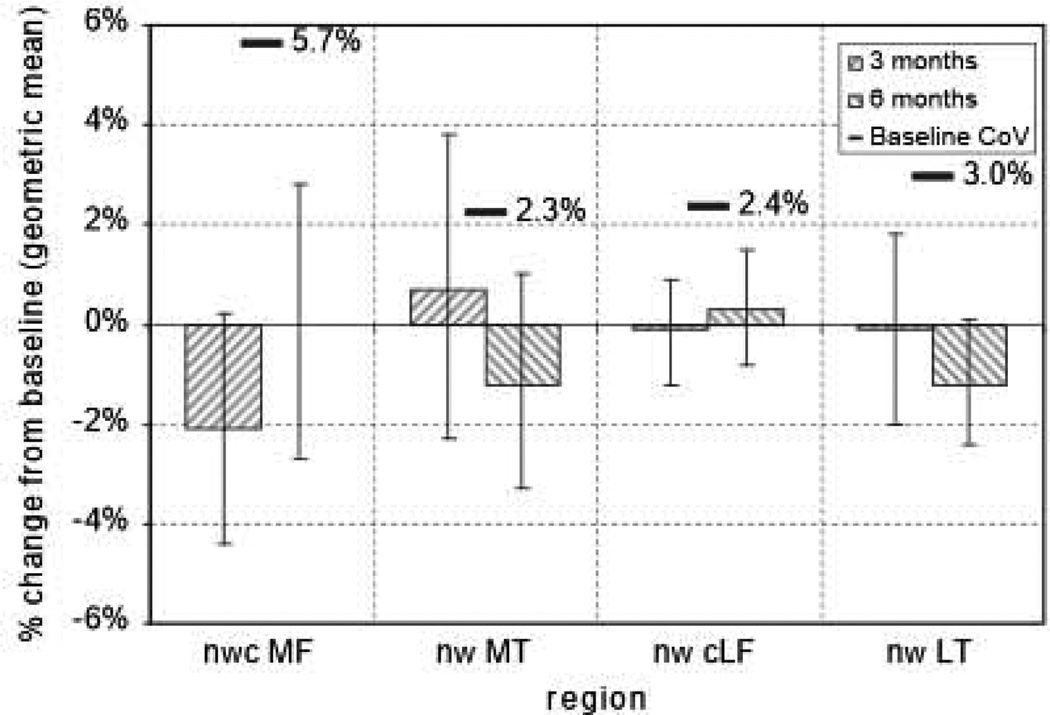
Fig. 3.
Changes at 3 and 6 months in MRI cartilage thickness (ThCtAB) in nuclear (trimmed) central meniscal windowed regions on the medial and LT and femur. The mean and 95% CI 1 estimates are from fitting ANOVA models to the log transformed data. The ANOVA models include the baseline measure as a covariate. The baseline is the geometric mean of the value at Visits 2a and 2b. CIs are not corrected for multiple comparisons. The baseline CoV overlaid is the within-subject.

