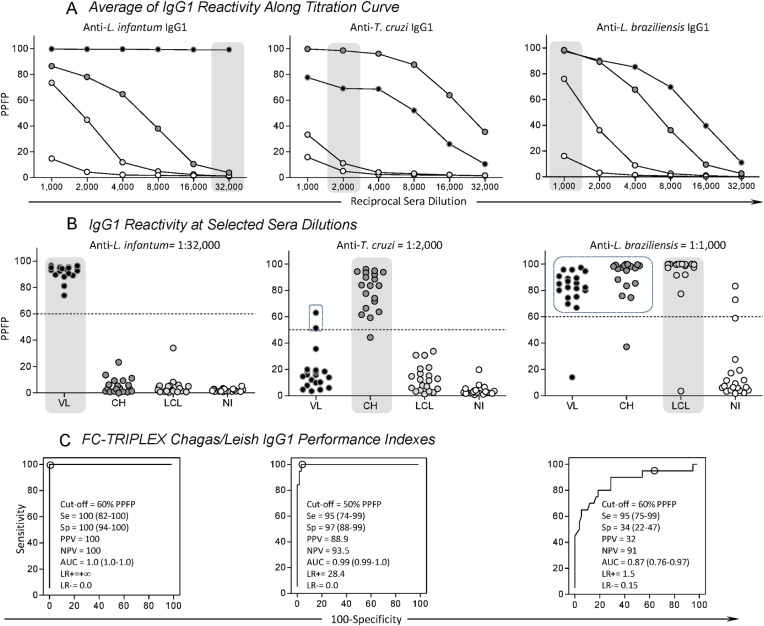
Fig 3. Species-specific anti-Trypanosomatidae IgG1 reactivity and flow cytometry-based triplex array (FC-TRIPLEX Chagas/Leish IgG1) performance indexes.
(A) Titration curve averages of percentages of positive fluorescent parasites (PPFP) for anti-Trypanosomatidae IgG1 in serum samples from patients with visceral leishmaniasis (VL, black circles), patients with Chagas disease (CH, dark gray circles), localized cutaneous leishmaniasis (LCL, light gray circles), and noninfected controls (NI, white circles). (B) Scattering plots for individuals at selected sera dilutions highlighted by gray round rectangles (VL, anti-L. infantum at 1:32,000; CH, anti-T. cruzi at 1:2,000; LCL and NI, anti-L. braziliensis at 1:1,000) using the cut-off edges (dotted lines), previously described by Garcia et al. [13], Matos et al. [15], and Pereira et al. [12]. PPFP = 60% for anti-L. infantum IgG1; PPFP = 50% for anti-T. cruzi IgG1; and PPFP = 60% for anti-L. braziliensis, respectively. (C) Receiver operating characteristic, ROC curve analyses confirmed the previously selected cut-off and demonstrated outstanding performance indexes: Se, sensitivity; Sp, specificity; PPV, positive predictive value; NPV, negative predictive value; AUC, area under the curve; LR+ and LR–, positive and negative likelihood ratios, respectively, for anti-L. infantum and anti-T. cruzi IgG1.

