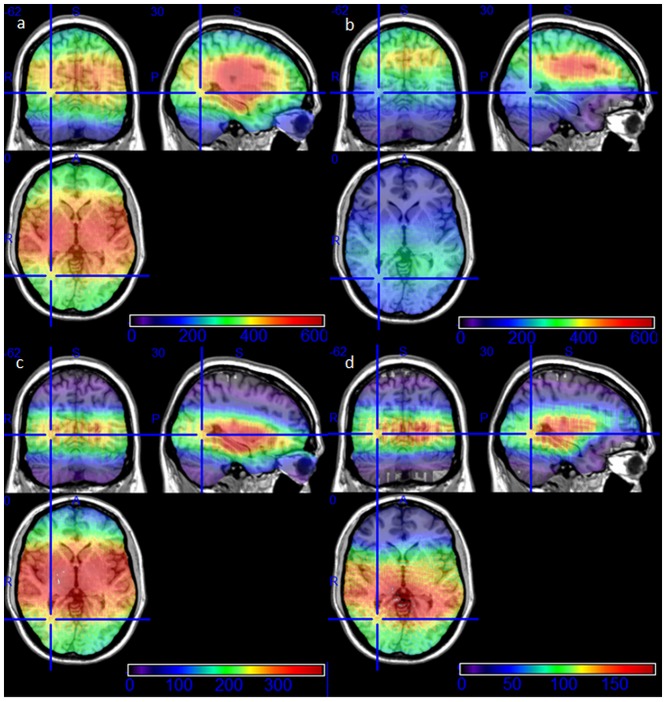
Fig 3. Anatomic correlation of the treatment beams using standardized MRI image series.
The different frequency can be seen in the colored bar. (a) Exposed brain areas during all 175 treatment sessions. Most beams were located in the center of the brain. (b) All beams passing the eyeballs in a distance > 4cm, so that direct beam path did not hit the eyeballs. (c) All beams which induced a visual sensation. Highest frequency is seen in the mid brain and temporal lobe, less in the occipital lobe, least in the parietal brain areas. (d) All beams passing the eyes in a distance > 4 cm inducing a visual sensation. Direct interaction of radiation with the retina is impossible for these visual perceptions. This anatomic correlation shows a high frequency along the intracerebral visual pathways.

