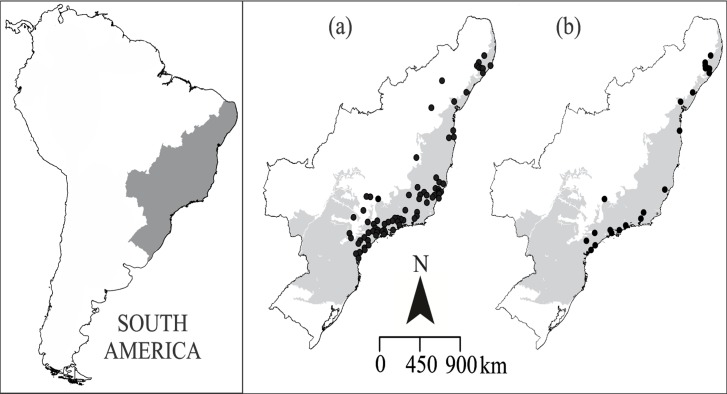
Fig 1. Geographic distribution of sampling localities of Akodon cursor.
A) 84 presence data entries used in the species distribution modeling. B) 22 localities used for the fluctuating asymmetry and morphological variance analysis. Light gray represents the boundaries of the Atlantic forest biome. South America map obtained from OpenStreetMap (free available at: http://www.openstreetmap.org/), and Atlantic forest biome shape obtained from MMA (free available at: http://mapas.mma.gov.br/i3geo/datadownload.htm). The image was edited using CorelDraw graphics Suite.

