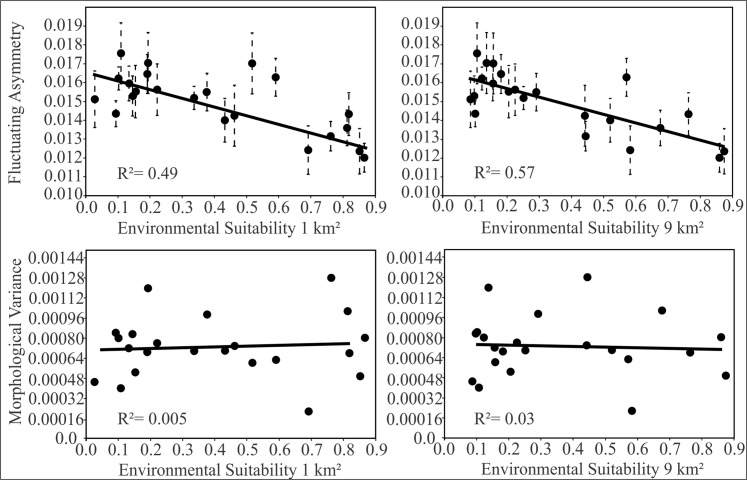
Fig 4. The relationship between fluctuating asymmetry, morphological variability, and environmental suitability.
The scatter plots are showing the relationship between fluctuating asymmetry and environmental suitability in two spatial scales (top) and the relationship between morphological variance and environmental suitability (down). The dashed bars represent the standard error. The value of the coefficient of determination is shown.

