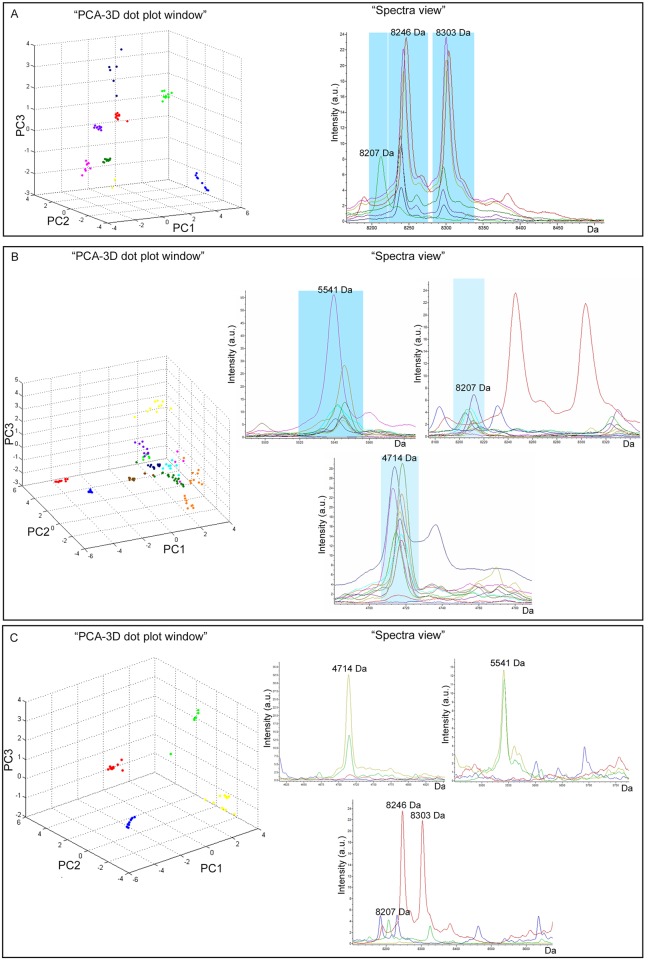
Fig 4. Comparative analysis of the average spectra obtained for clinical isolates and reference strains E. histolytica HM-1:IMSS, E. dispar SAW760, and E. moshkovskii Laredo spectra.
(A) “PCA-3D dot plot windows” showing the spectra of E. dispar SAW760 (in green) and E. moshkovskii Laredo (blue) clustering separately from the group including E. histolytica HM-1:IMSS (red) and all E. histolytica clinical isolates reported in yellow (369), dark green (373), violet (1238), pink (8026) and dark blue (3291); “Spectra view” of the 2 discriminating peaks of E. histolytica HM-1:IMSS average spectra (red) compared to all E. histolytica clinical isolates average spectra reported in yellow (369), dark green (373), violet (1238), pink (8026) and dark blue (3291) and E. dispar SAW760 average spectra (green) (B) “PCA-3D dot plot windows” showing the spectra of E. histolytica HM-1:IMSS (red) and E. moshkovskii Laredo (blue) clustering separately from the group including E. dispar SAW760 (green) and all E. dispar clinical isolates reported in yellow (1557), dark green (217), violet (2550), pink (1110), dark blue (240), brown (417), orange (368), and light blue (1382); “Spectra view” of the 3 discriminating peaks of E. dispar SAW760 average spectra (green) compared to all E. dispar clinical isolates average spectra reported in yellow (1557), dark green (217), violet (2550), pink (1110), dark blue (240), brown (417), orange (368), and light blue (1382) and E. histolytica HM-1:IMSS average spectra (red). (C) “PCA-3D dot plot windows” showing the spectra of the clinical isolate E. histolytica 1656 (yellow) clustering separately from E. histolytica HM-1:IMSS (red), E. dispar SAW760 (green) and E. moshkovskii Laredo, (blue); “Spectra view” of the discriminating peaks found for the clinical isolate E. histolytica 1656 average spectra compared to three reference strains average spectra.

