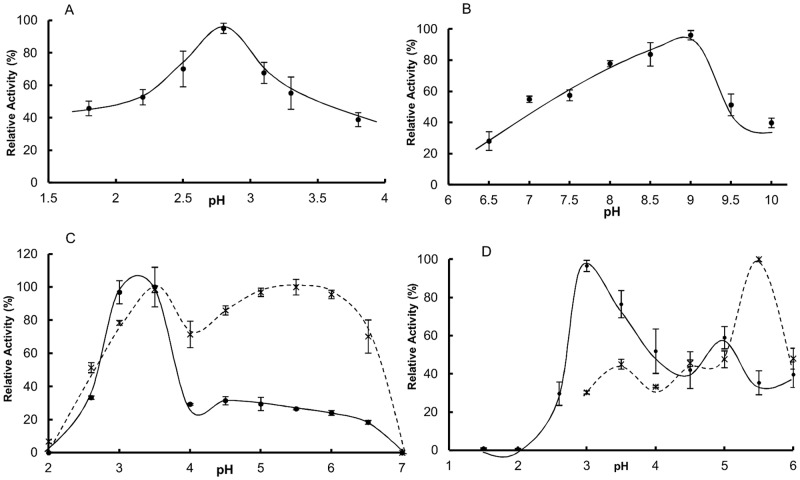
Fig 3. Effect of pH on endopeptidase activities using different substrates.
Sample source was either crude MMG extracts (A and B) or chromatographically separated (C and D). (A) Hemoglobin 2%. (B) Casein-FITC 0.2%. C) Activated (✱) and non-activated (●) C1 samples. (D) Effect of pH on isolated cysp1 (✱) and cysp2 (●) samples. Buffers used (100 mM): Gly-HCl, pHs 1.5 and 2; Citrate-phosphate, pHs 2.6–7; MES, pH 7; TRIS-HCl, pHs 7.5–9; Gly-HCl 9.5–10. Buffers used in A, C and D contain 3 mM cysteine and 3 mM EDTA.

