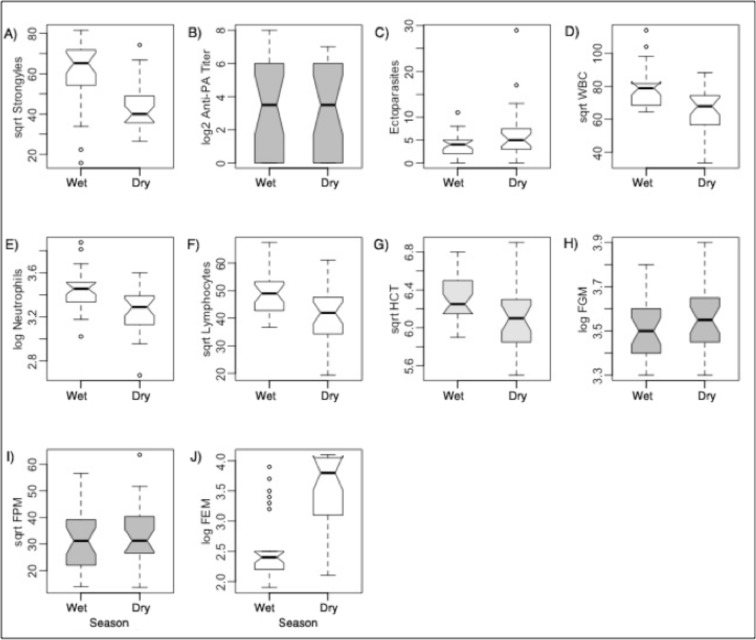
Fig 1. Pairwise comparisons of pathogens, immune factors, and hormones between rain groups for the same captured zebra individuals resampled twice.
Center lines in boxplots represent medians, with notches extending to ±1.58 IQR/ where IQR is the interquartile range and N is the sample size. Notches that do not overlap provide strong evidence that the medians differ (Chambers et al. 1983) (not shown for log2PA because notches grossly overlapped the ends of the boxes). The box hinges represent nearly the first and third quartiles, with whiskers showing the largest and smallest observations 1.5 times the box size from the nearest hinge. Points outside this range are shown as open circles. Boxplots in white are for variables that are significantly different from each other by t tests or Wilcoxon rank sum tests, whereas gray boxplots are not significantly different. sqrtHCT is light gray because the rain group for this variable was nearly significant (p = 0.080).

