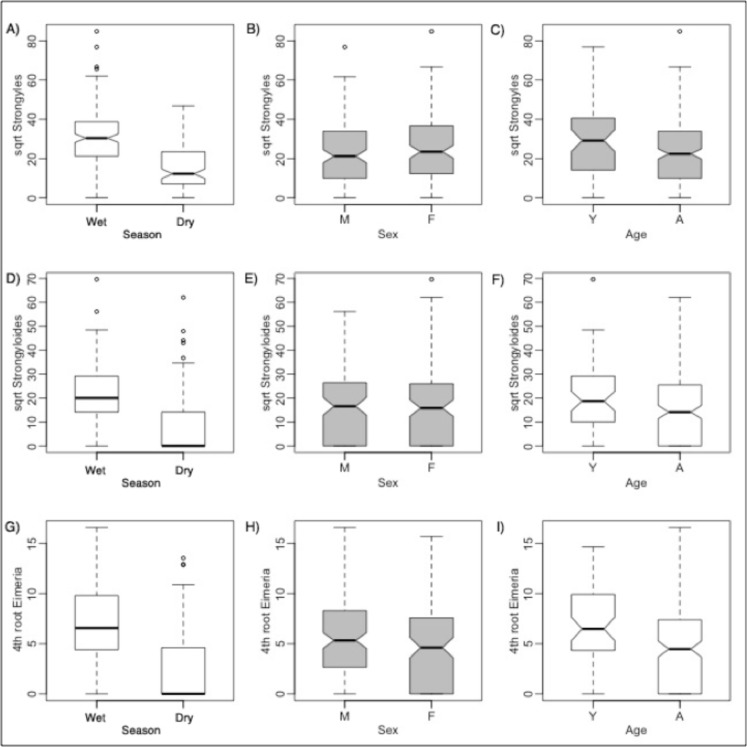
Fig 4. Comparisons of parasites between rain groups, sexes, and ages for springbok.
For clarity, comparisons between interaction effects are not shown. Boxplot statistics are interpreted as in Fig. 1. Boxplots in white are for variables that are significantly different from each other by Tukey's t tests or Wilcoxon rank sum tests, whereas gray boxplots are not significantly different. Though non-transformed parasite counts for all parasites were compared with Wilcoxon rank sum tests, they are fourth root and square root transformed here (as close to normality as possible) for clarity.

