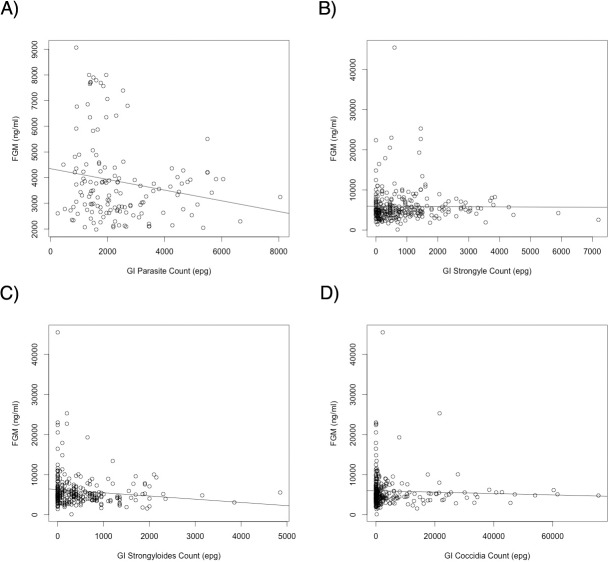
Fig 6. Tolerance curves indicating the relationship between a measure of host health and pathogen load.
FGM (a measure of host chronic stress responses) is used here as a proxy of host health, and is measured against the range of various GI parasite types found in these hosts. A) Zebra and strongyle parasites; B) Springbok and strongyle parasites; C) Springbok and Strongyloides parasites; D) Springbok and coccidian parasites. With a lack of host tolerance to these parasites, one would expect to see an increase in FGM (decrease in host health) with increased parasite infection intensities (as indicated by increasing epg—eggs per gram of feces—counts) [101] Instead, these hosts experience either no increase in FGM, or a decrease in FGM with increased parasite infection intensities in all instances.

