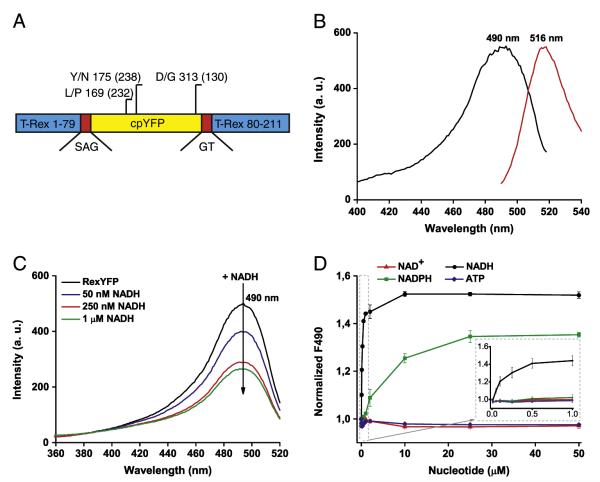
Fig. 1.
A) Diagram of the RexYFP structure. RexYFP consists of cpYFP (yellow) integrated between residues 79 and 80 of T-Rex (blue) via short polypeptide linkers SAG and GT (red). The diagram shows mutations in the structure of RexYFP (numbers in parentheses indicate the position for EYFP). B) Fluorescence spectra of RexYFP. Excitation spectrum has a maximum at 490 nm. Emission spectrum has a maximum at 516 nm. C) Excitation spectrum of RexYFP (250 nM) in Tris–HCl (pH 7.5) with 150 mM NaCl and 10 mM MgCl2 upon addition of NADH (50, 250, 1000 nM) to the probe. Emission was measured at 530 nm. D) Dependence of RexYFP signal on concentrations of various nucleotides (NAD+, NADH, NADPH, ATP) in range of concentration from 10 nM to 50 μM in the probe (Tris–HCl (pH 7.5), 150 mM NaCl, 10 mM MgCl2). The RexYFP signal is expressed as 1/F490. Plotted line for each type of nucleotide is the result of five independent experiments.

