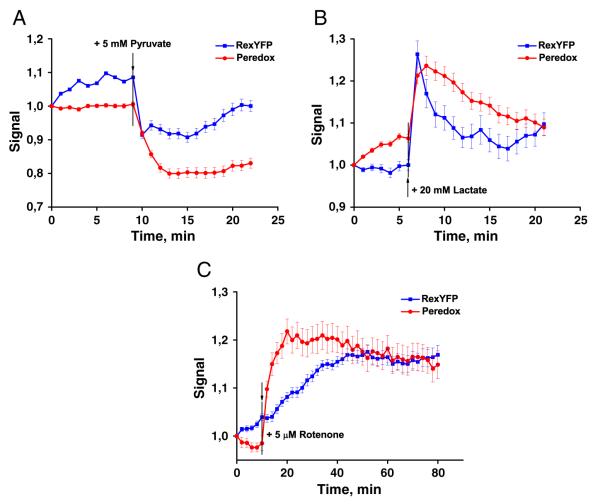
Fig. 3.
Responses of RexYFP (blue line) and Peredox (red line) to the addition of A) 5 mM pyruvate B) 20 mM lactate. HEK293 cells transiently expressing the sensors were imaging in presence of glucose (2 g/L). Peredox signal is calculated as F405/F561; RexYFP as F490HyPer-C199S/F490RexYFP. Signal values of RexYFP and Peredox were normalized to the initial value. Signals were averaged from 55 cells for RexYFP and 38 cells for Peredox in 3 experiments with pyruvate; from 36 cells for RexYFP and 50 cells for Peredox in 3 experiments with lactate. Error bars indicate standard error of mean. C) RexYFP (blue line) and Peredox (red line) responses in the cytoplasm of HeLa cells incubated with 5 μM rotenone. Signals were averaged from 43 cells for RexYFP and 57 cells for Peredox in 3 experiments; error bars indicate standard error of mean.

