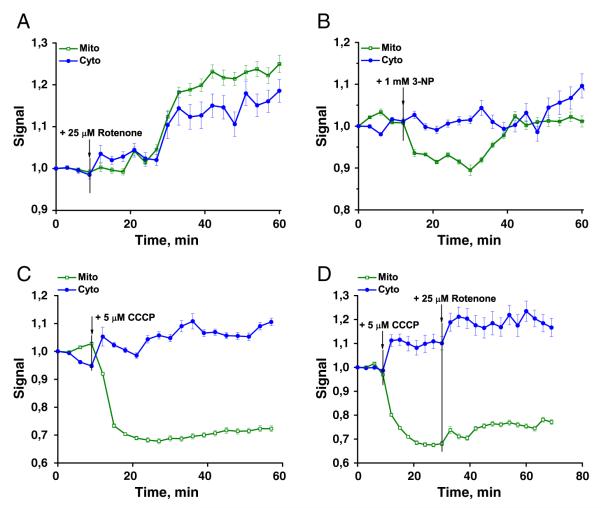
Fig. 4.
RexYFP signal (F490HyPer-C199S/F490RexYFP normalized to the initial value) in the cytoplasm (blue line) and in the mitochondria (green line) of HeLa cells after addition of A) 25 μM rotenone (signals were averaged from 36 cells with mito-localization of the sensor and 48 cells with cyto- in 3 experiments); B) 1 mM 3-NP (from 62 cells with mito- and 57 cells with cyto- in 4 experiments); C) 5 μM CCCP (from 38 cells with mito- and 49 cells with cyto- in 3 experiments); D) 5 μM CCCP with subsequent addition of 25 μM rotenone (from 42 cells with mito- and 37 cells with cyto- in 3 experiments). Error bars indicate standard error of mean.

