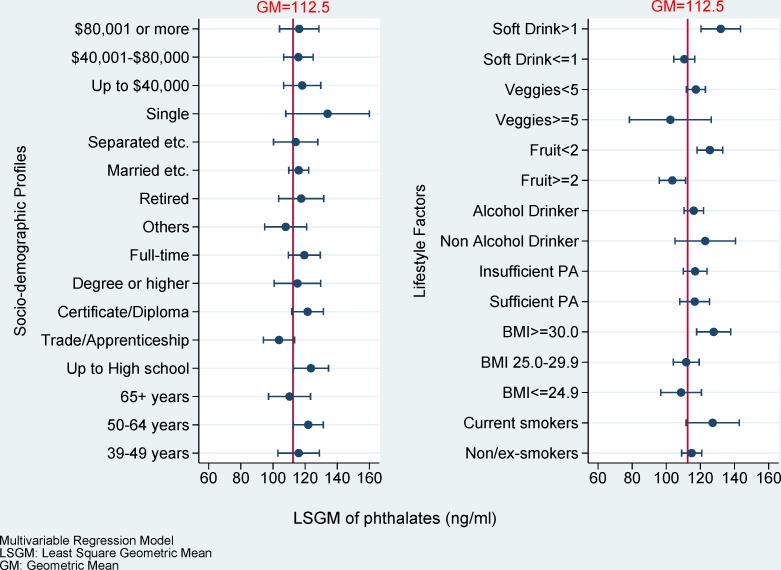
Fig 2. The LSGM of phthalate concentration among socio-demographic status and lifestyle factors.
Margins with exponential transferring and marginsplot syntax were used to plot after linear regression mutually adjusting for age, education, employment status, marital status, household annual income, smoking, body mass index (BMI), physical activity, alcohol consumption per day, fruit consumption per day, vegetables consumption per day and carbonated soft drinks consumption per day.

