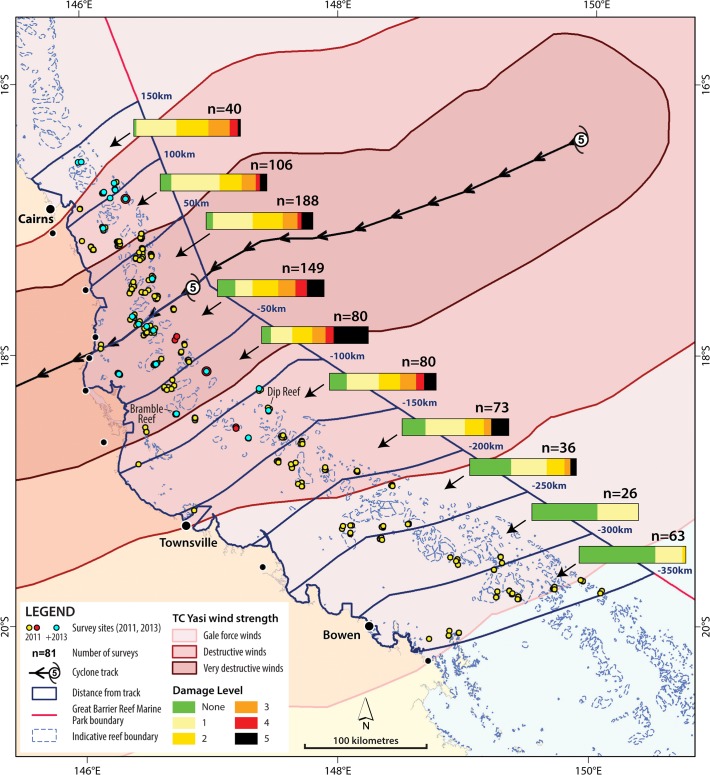
Fig 2. TC Yasi survey reef locations (surveyed February 10 to March 17, 2011 and from January 1 to September 30, 2013).
Bar charts for each 50-km Marine Park segment north and south of the track of TC Yasi represent the proportion of surveys that recorded each of 5 levels of damage (n = 841). Locations in red denote reefs where ≥60% of the surveys recorded structural damage (level 4 or 5) and the two labeled reefs are the locations in Fig. 8. Locations in blue were surveyed during both 2011 and 2013. See Figs. 3 and 4 for damage level descriptions.

