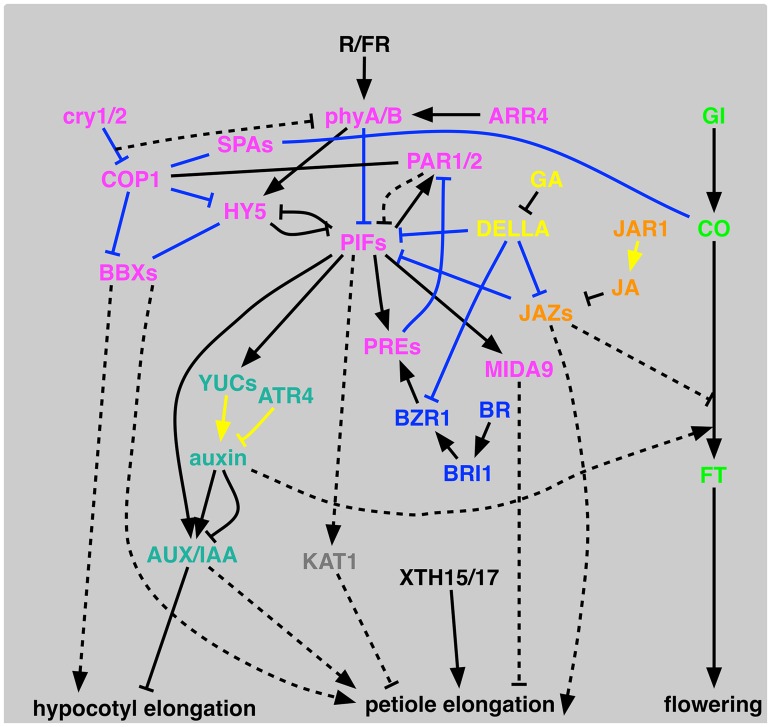
Fig 3. Schematic representation of proposed signal transduction for shade-avoidance syndrome.
PIFs represent PIF3, PIF4, PIF5, PIF7, PIL1, and SPT. JAZs represents JAZ5 and JAZ10. Black lines represent genetic interactions, blue lines show direct interactions, and yellow lines show hormone biosynthesis/metabolism. Lines without arrowheads are for interactions where directionality is unknown. Dashed lines show hypothetical interactions. SCL13 is omitted because of its unknown function within this context.

