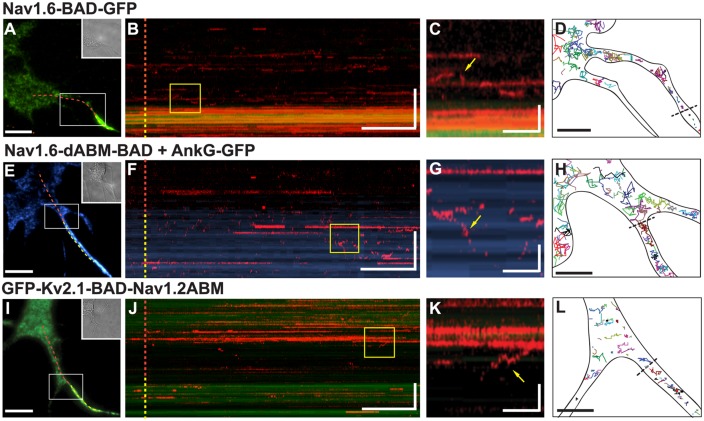
Fig 7. AnkyrinG binding is necessary to confer directed delivery to the AIS.
Insertion site experiments were performed as outlined in Fig 4A for hippocampal neurons transfected with either full-length Nav1.6-BAD-GFP (A-D), Nav1.6-dABM-BAD and ankG-GFP (E-H), or GFP-Kv2.1-BAD-Nav1.2ABM (I-L). A,E,I) Reference images for the kymographs with the dotted line indicating the line scan starting in the soma (red) and continuing through the AIS. B,F,J) Kymographs of line scans indicating location of newly inserted channels over time as indicated by SA-594. C,G,K) Enlargements of yellow boxes in kymographs. Immobile channels appear as persistent horizontal lines, while mobile channels are represented by the vertical movements (yellow arrows) in the kymograph or brief appearances as channels cross the line scan. D,H,L) Representative single molecule tracks illustrating channel mobility. The black dotted lines indicate the soma/AIS boundary. Neurons were transfected on DIV4 and imaged 36–44 hrs post-transfection for the Nav1.6 constructs or 12–15 hrs post-transfection for the GFP-Kv2.1-BAD-Nav1.2ABM construct. Scale bars for A,E,I represent 10 μm. Scale bars for B,F,J represent 2 min (horizontal) and 10 μm (vertical). Scale bars for C,G,K represent 15 sec (horizontal) and 3 μm (vertical). Scale bars for D,H,L represent 5 μm.

