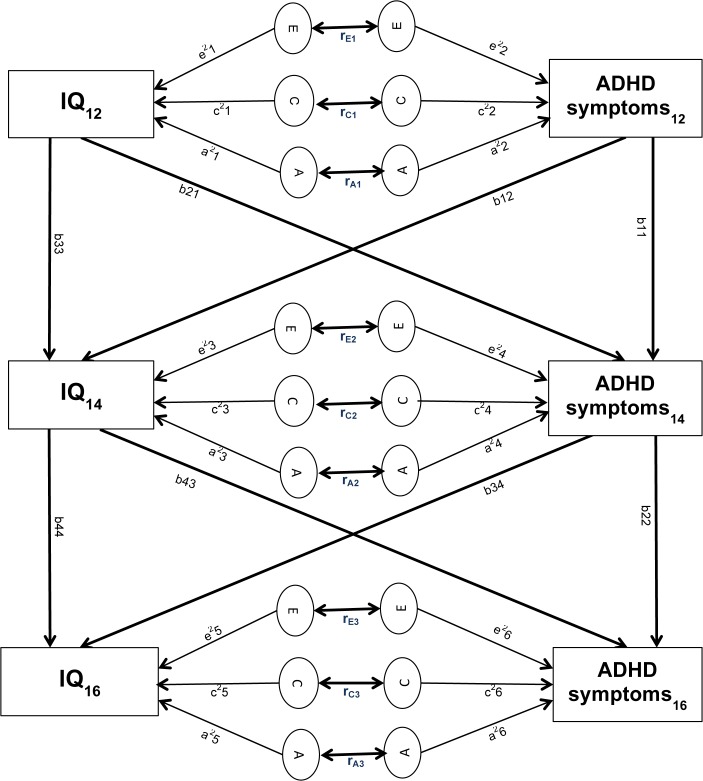
Fig 1. Cross-lagged twin model.
Circles represent latent genetic (A), shared environmental (C) and non-shared environmental (E) factors for ADHD symptoms and IQ at time 1 (age 12), time 2 (age 14) and time 3 (age 16). Paths from the latent A, C, E factors to the observed variables (a1–a6, c1–c6, e1–e6) represent genetic and environmental contributions to ADHD symptoms and IQ scores. The environmental and genetic correlations between ADHD symptoms and IQ for each time point are indicated below the arrows connecting the respective circles (rE, rC, rA). Stability paths (b11, b22, b33, b44) connect the same traits across time. Cross-lagged paths (b12, b21, b34, b43) connect different traits across time.

