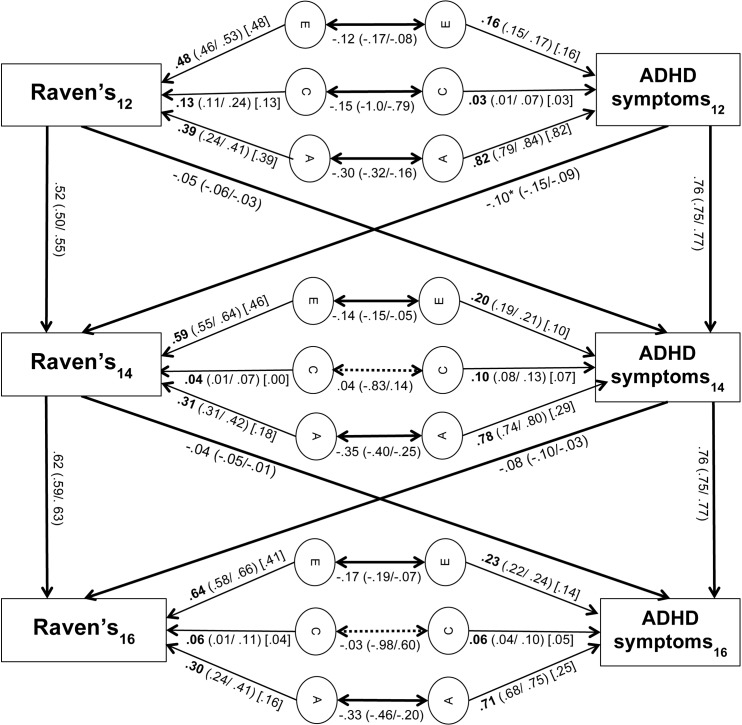
Fig 3. Cross-lagged path model of Raven’s and ADHD symptom scores.
95% confidence intervals are provided in brackets. Values in square brackets [] represent time-specific genetic and environmental contributions to ADHD symptoms and Raven’s Progressive Matrices Scores. Asterisks indicate the significantly greater path at the p = 0.05 level. Non-significant paths are indicated by dashed lines.

